
If your mod rate is sitting above 1.0, you’ve already felt the downstream effects: workers’ comp premiums that don’t budge even when you’ve had a clean year, PEO proposals loaded with surcharges, and carriers who either decline you outright or quote you into a corner. The frustrating part isn’t the rate itself — it’s that most of the advice you get assumes you’re starting from a clean slate.
This guide assumes you’re not. It’s built for businesses carrying elevated mod rates who need a real financial model before committing to a PEO or staying on standalone coverage. Not a ballpark. Not a back-of-napkin comparison. An actual projection that accounts for your current trajectory, the lag built into experience rating, and the very different ways PEOs handle high-mod accounts.
The steps below walk you through pulling your loss data, building your cost baseline, modeling multiple scenarios, and using that analysis to evaluate PEO proposals on your terms instead of theirs. If you’ve ever sat across from a PEO sales rep who couldn’t clearly explain how their workers’ comp pricing works for your specific mod situation, this is the model that changes that dynamic.
One thing this guide won’t do: explain what a mod rate is or how NCCI calculates it. You know that already. What most businesses don’t have is a structured way to translate that mod rate into a forward-looking cost model that actually drives the PEO decision. That’s what we’re building here.
Step 1: Pull Your Loss Runs and Pin Down Your Actual Mod Trajectory
Before you build anything, you need the raw material: 3-5 years of loss run data from your current carrier or PEO. Request these in writing. Your broker can pull them, or you can request them directly from the carrier. If you’re currently in a PEO, request the loss runs specific to your account — some PEOs bundle this under the master policy, which can make it harder to get clean account-level data, but you’re entitled to it.
What you’re looking for isn’t just the mod rate number. You want the underlying claims data: date of injury, claim type, total incurred (paid plus reserve), and whether the claim is open or closed. That last distinction matters more than most people realize.
Open claims inflate your mod disproportionately. Because experience rating uses total incurred costs — not just what’s been paid out — an open claim with a large reserve can be dragging your mod significantly even if the actual payments to date are modest. When you pull your loss runs, flag every open claim and note the reserve amount. These are the numbers most likely to shift over the next 1-2 years, which means your mod trajectory isn’t fixed — it’s a moving target, and your model needs to treat it that way.
Once you have the data, plot your mod year over year. You’re looking for one of three patterns: trending upward (claims are accumulating faster than older claims are aging out), plateauing (roughly stable, often with one or two claims keeping it elevated), or starting to decline (older high-cost claims are rolling off the 3-year window). Each of these requires a different modeling posture. For a deeper look at how PEOs approach these different mod situations, see this guide on PEO strategies for high insurance mod rates.
Next, categorize your claim types. Frequency-driven mods — lots of smaller claims — and severity-driven mods — one or two large claims — behave differently in the experience rating formula and respond differently to PEO interventions. A PEO with strong safety program infrastructure can help you attack a frequency problem. A severity problem tied to a single catastrophic claim is largely a waiting game: you need that claim to close and age out of your window. Knowing which situation you’re in changes what you should be asking PEOs to actually deliver.
By the end of this step, you should have a clear year-over-year mod trajectory, a list of open claims with reserve amounts, and a sense of whether your rate is structurally improving or still being held up by claims that haven’t resolved. That’s your starting point for everything that follows.
Step 2: Map Your Fully Loaded Cost of Risk — Not Just the Premium Line
Here’s where most cost comparisons go wrong. Businesses look at their workers’ comp premium, get a PEO quote, and try to compare the two. The problem is that premium is only part of what workers’ comp actually costs you.
Build a complete cost-of-risk baseline before you touch any PEO proposal. This means adding up:
Direct costs: Your workers’ comp premium, any deductible or retro adjustment payments, claim management fees if you’re using a third-party administrator, and any loss control services you’re paying for separately.
Administrative overhead: The internal time your HR team or operations staff spend managing claims, coordinating with the carrier, handling return-to-work logistics, and staying current on OSHA compliance. This is real cost even if it doesn’t show up on an insurance invoice. Estimate it honestly in hours per month and assign a dollar value. A structured cost modeling approach comparing PEO vs internal HR can help you quantify these hidden expenses accurately.
Indirect operational costs: Light-duty program expenses, temporary replacement labor when workers are out, productivity drag from safety gaps that haven’t been addressed, and any fines or penalties from compliance issues. These vary widely by industry and workforce, but ignoring them understates your true cost of risk.
If you’re currently inside a PEO, this step requires an extra layer of work. Most PEOs bundle workers’ comp into an all-in administrative fee or a per-employee-per-month rate that makes it deliberately difficult to isolate what you’re actually paying for workers’ comp coverage versus payroll administration, HR support, and benefits access. Push your PEO contact for a breakdown. If they won’t provide one, that’s useful information on its own.
The number you land on at the end of this step becomes your benchmark. Every PEO proposal you evaluate gets compared against this fully loaded annual cost of risk — not against your premium in isolation. This is the comparison that actually tells you whether a PEO is saving you money or just restructuring how you pay for the same exposure.
A common mistake: comparing a PEO’s “all-in” rate against a standalone premium-only number. It makes the PEO look expensive when it might not be, or it obscures real savings by mixing unlike categories. Apples to apples means total cost of risk on both sides of the ledger.
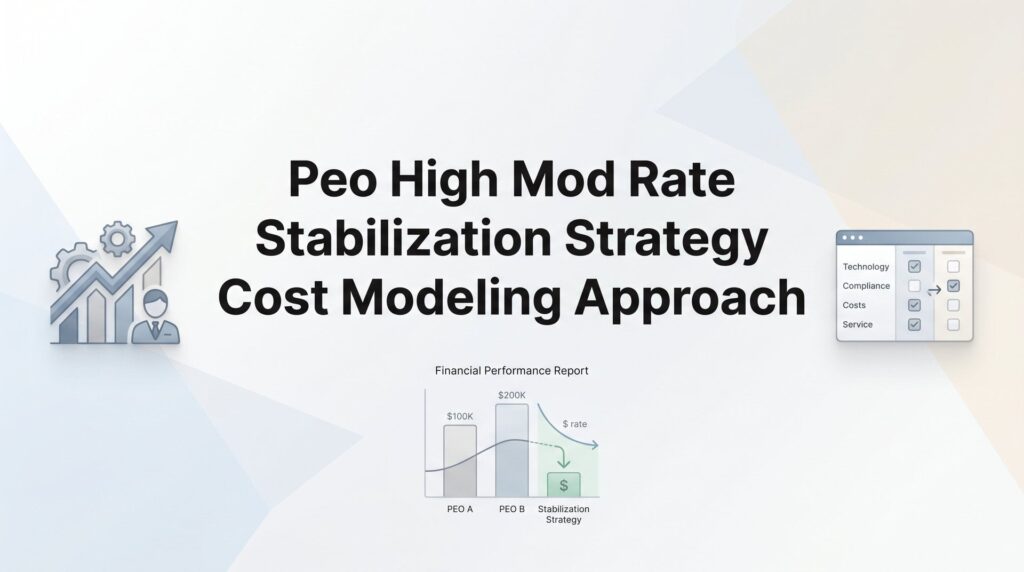
Step 3: Build a 3-Year Stabilization Projection With Multiple Scenarios
Now you’re ready to build the actual model. The goal here is a spreadsheet that shows projected annual workers’ comp costs over the next three years under multiple scenarios — both for staying on standalone coverage and for moving to a PEO. Three years matters because of the lag effect built into experience rating: mod rate improvements from safety investments typically take two to three years to fully flow through your rate, which means short-term costs often stay elevated even when you’re doing everything right.
Model three scenarios:
Scenario A — Mod holds flat: No new significant claims, but your current open reserves don’t close favorably either. Your mod stays roughly where it is for the projection window. This is your conservative baseline.
Scenario B — Mod improves on schedule: Your open claims resolve at or below reserve, no new frequency or severity issues emerge, and your mod begins declining by the next adjustment cycle. Model the specific rate reduction you’d expect based on which claims are rolling off your 3-year window and when.
Scenario C — Mod worsens: A new claim hits during the projection period, or an open reserve increases. Your mod ticks up further. This is your stress test scenario — the one most businesses skip because it’s uncomfortable to model.
For each scenario, calculate projected workers’ comp costs under standalone coverage using your carrier’s current rate structure and your projected mod. Then apply the same scenarios to PEO pricing — but here’s where you need to be careful. A solid PEO financial modeling template can help you structure these projections consistently across all scenarios.
PEOs handle high-mod accounts in fundamentally different ways. Some PEOs place clients under a master policy where your individual mod has limited direct impact on pricing — the PEO’s aggregate loss experience drives the rate. Others essentially pass your mod through with an administrative markup, which means you’re not actually getting the benefit of the master policy structure. Understanding how workers’ comp cost allocation models work across different PEOs is essential before plugging numbers into your spreadsheet. Ask them directly: does your pricing reflect my mod rate or your aggregate experience? Get it in writing.
Also factor in risk surcharges and participation fees. Many PEOs charge high-mod accounts a surcharge on top of their standard workers’ comp rate. These fees are sometimes disclosed upfront, sometimes buried in the contract. Before you plug a PEO’s quoted rate into your model, confirm whether it already includes any high-mod adjustments or whether those come later.
By the end of this step, you should have a spreadsheet with nine data points: three scenarios times three years, showing projected annual workers’ comp costs for both the standalone path and the PEO path. Where the lines cross — or where they don’t — tells you a lot about which option actually makes sense for your situation.
Step 4: Stress-Test PEO Proposals Against Your Model
You have your model. Now you run actual PEO proposals through it. This is where the analysis gets real, and where most businesses give up too much ground by accepting proposals at face value.
Start with a simple request: ask every PEO you’re evaluating for itemized pricing that separates workers’ comp costs from administrative fees, benefits, and payroll services. Some will comply. Some will push back, claiming their pricing is bundled by design. If a PEO refuses to break out the workers’ comp component, that’s a significant red flag. You can’t evaluate what you can’t see, and a provider who won’t show you the workers’ comp line item is a provider who doesn’t want you doing the math.
Once you have itemized rates, compare the PEO’s quoted workers’ comp cost against your modeled standalone cost under each of your three scenarios. Pay specific attention to Scenario C — the one where your mod worsens. Ask the PEO directly: what happens to your rate if we have a bad claims year? Does your pricing adjust mid-term, or are you locked in for the policy period? Understanding the financial impact analysis for high-mod stabilization helps you frame these questions with precision.
Evaluate loss control substance, not marketing. Most PEOs will tell you they have “robust safety programs.” What you want to know is: do they provide a dedicated safety consultant for your account, how often do they conduct on-site visits, what’s their claims management process when a new injury occurs, and can they show you measurable outcomes from their safety work with comparable clients? If their loss control offering amounts to a safety manual and an online training portal, that’s not going to move your mod. Factor that into your model — if you’d need to fund meaningful safety improvements independently regardless, that’s an additional cost that belongs in the PEO comparison.
The critical question to ask every PEO: does your pricing assume my mod rate improves over the contract term, and what happens contractually if it doesn’t? Some PEOs build their economics around a declining mod trajectory. If yours doesn’t improve on schedule, you may find yourself facing a renewal rate increase that wasn’t visible in the original proposal.
Step 5: Negotiate Using Your Model — Not Their Proposal Template
Most PEO contract negotiations happen on the provider’s terms. They send a proposal, you review it, you maybe push back on the headline rate, and you sign. If you’ve built the model described in the previous steps, you can run this process differently.
Your 3-year projection gives you specific leverage points. If your model shows that standalone coverage becomes competitive within 18-24 months as your mod improves, you can use that as a negotiating position: either the PEO offers rate adjustment provisions tied to your mod trajectory, or you have a credible reason to stay independent. That’s not a bluff — it’s math, and good PEO providers know it.
Push for specific contractual commitments rather than verbal assurances. The things worth getting in writing include: how workers’ comp pricing adjusts if your mod changes, what loss control resources are guaranteed as part of your account (not just “available”), how often your mod rate and cost-of-risk will be formally reviewed, and what the process is for renegotiating terms if your claims experience improves significantly. A clear understanding of renewal clause negotiation strategies can strengthen your position on each of these points.
Rate caps are worth asking for, especially in a high-mod situation where you’re taking on some risk by entering a PEO relationship. A cap on workers’ comp rate increases during the contract term protects you if your mod doesn’t improve as projected. Not every PEO will offer this, but asking the question separates providers who are confident in their model from those who aren’t.
Be honest about when a PEO genuinely makes sense for a high-mod business. If the PEO’s master policy structure actually absorbs your mod and their loss control resources are substantive, the math can work in your favor even with a surcharge. The businesses that benefit most from PEOs in this situation are usually those with frequency-driven mod problems and limited internal safety infrastructure — where the PEO’s operational support creates real improvement, not just a different billing structure.
If the PEO’s pricing only pencils out under the optimistic scenario and falls apart under flat or worsening mod assumptions, that’s your answer. You’d be taking on risk without getting real protection in exchange.
Step 6: Build Review Triggers So the Model Stays Useful After You Sign
A cost model that sits in a drawer after contract signing isn’t a cost model — it’s a document that made you feel better in the moment. The point of this analysis is to give you a living framework for managing the PEO relationship over time, not just to win the initial negotiation.
Set quarterly review checkpoints. At each checkpoint, compare your actual claims activity and costs against the projections in your model. If you’re tracking ahead of your Scenario B (mod improving faster than expected), you have leverage at renewal. If you’re drifting toward Scenario C, you need to know that early enough to act — not when the renewal quote lands on your desk.
Define specific renegotiation triggers before you sign. For example: if your mod drops below a certain threshold during the contract term, your workers’ comp rate should adjust accordingly. If the PEO won’t agree to that in writing, build it into your renewal strategy instead — you’ll have the data to push hard when the time comes. Having a clear experience mod correction strategy ensures you know exactly what milestones to target.
Track whether the PEO’s safety and claims management resources are actually being delivered. If your contract specifies quarterly on-site safety visits and you haven’t had one in six months, that’s both a service failure and a missed opportunity to move your mod. Document it.
Finally, define your exit criteria upfront. What mod rate and cost-of-risk numbers would make switching providers or going standalone the better move? Having these thresholds defined before you’re in the middle of a renewal conversation keeps the decision grounded in your model rather than in the friction of switching costs or relationship inertia. Understanding the risk mitigation dimensions of high-mod stabilization helps you set realistic exit thresholds.
The goal is a living document with review dates, trigger thresholds, and clear decision criteria. If you’ve built it right, it tells you what to do next — not just what you decided last year.
Your Next Move
A high mod rate doesn’t lock you into bad options. It just means you need sharper math before committing to anything. The businesses that get hurt are the ones who accept PEO proposals at face value without modeling what their costs actually look like over a 2-3 year stabilization window.
Before you move forward, run through this checklist:
1. You have 3-5 years of loss runs with claim-level detail, including open claim reserves.
2. You know your fully loaded cost of risk — not just your premium line.
3. You’ve modeled at least three scenarios across both the PEO and standalone paths.
4. You’ve stress-tested actual PEO proposals against your model, with itemized pricing in hand.
5. You’ve negotiated terms based on your numbers, with key commitments in writing.
6. You have review triggers and exit criteria built into your agreement from day one.
If you’re in the middle of evaluating PEO providers and want to see how their workers’ comp pricing actually compares with real data behind it, PEO Metrics provides side-by-side comparisons that go well beyond what a sales deck shows you. Don’t auto-renew. Make an informed, confident decision.