
Most business owners comparing PEO proposals spend their time on admin fees, per-employee costs, and benefits spreads. That makes sense. Those are the numbers staring at you from every proposal deck. But there’s a less visible cost that can dwarf all of those line items combined: catastrophic claim exposure.
A single severe workers’ comp injury or a catastrophic health insurance claim can blow up your cost projections for years. And different PEO arrangements handle that exposure in wildly different ways. Some PEOs absorb it through fully insured master policies. Others pass portions of it back to you through loss-sensitive rating, retro adjustments, or aggregate stop-loss gaps you didn’t know existed.
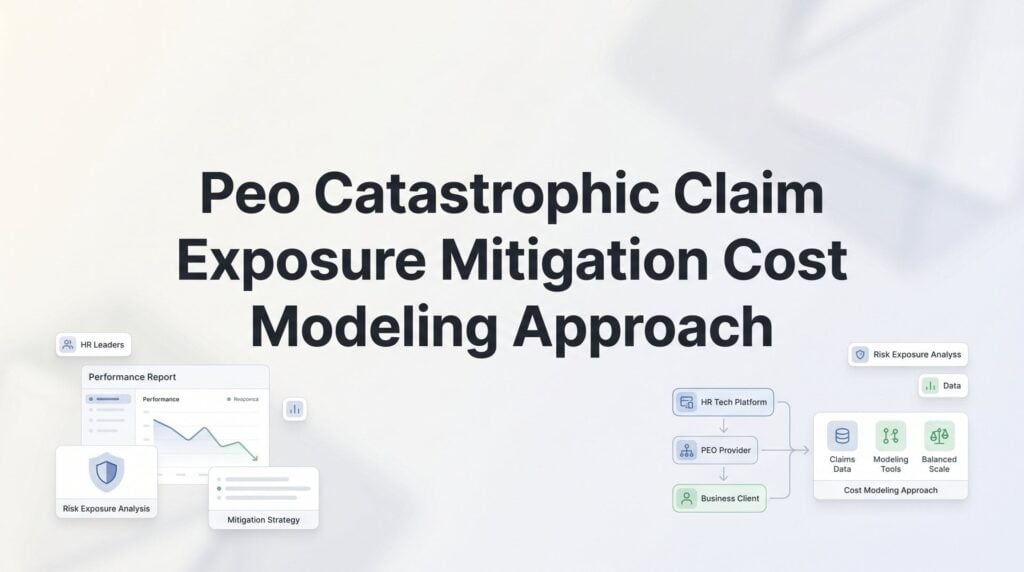
If you don’t model how each provider handles catastrophic claims before you sign, you’re essentially budgeting blind for your worst-case scenario.
This guide walks you through a practical, step-by-step cost modeling approach for catastrophic claim exposure across PEO arrangements. It’s built for business owners and HR leaders who want to compare providers on more than surface-level pricing and who want to understand what happens financially when something goes seriously wrong.
You don’t need an actuarial background. You do need your current claims data, your PEO proposals, and a willingness to ask providers uncomfortable questions about where their coverage ends and your liability begins. Let’s get into it.
Step 1: Map Your Current Catastrophic Exposure Baseline
Before you can compare how different PEOs handle catastrophic claims, you need to understand your own starting point. Most businesses skip this entirely, which is exactly why they end up surprised later.
Start by pulling your large-loss history from both workers’ comp and group health. Focus specifically on claims that exceeded $100,000 over the past three to five years. You’re looking for two things: how many of these events occurred, and what the total cost impact was across claim payments, reserves, and any resulting rate changes at renewal.
If you’re in construction, manufacturing, warehousing, or healthcare, your catastrophic claim frequency profile looks fundamentally different from a professional services firm with 50 desk employees. A software company might go a decade without a single large workers’ comp claim. A roofing contractor might see one every few years. That industry context matters enormously when you’re modeling forward exposure, and it should inform how seriously you interrogate each PEO’s catastrophic risk structure.
Next, document your current stop-loss attachment points if you’re already in a PEO or running a self-insured health plan. Specific stop-loss kicks in when a single claimant’s costs exceed a defined threshold — often somewhere between $50,000 and $150,000 depending on the program. Aggregate stop-loss limits your total claims exposure across your entire employee population for the year. Both numbers matter, and both can have gap periods or exclusion language that left you carrying uninsured exposure without realizing it.
If you’ve had a gap in coverage, a change in carriers, or a period where claims were in run-out under a prior arrangement, note that too. These are the periods where catastrophic claim exposure can slip through the cracks between programs.
What you’re building here: A one-page summary that shows your industry risk profile, your large-loss history, your current stop-loss structure, and any known exposure gaps. This becomes your baseline for comparing how each PEO proposal changes your risk position, not just your monthly cost.
One practical note: if you don’t have clean claims data, ask your current broker or TPA for a loss run report. This is standard practice and any competent broker should be able to pull it quickly. If your current PEO is reluctant to provide detailed loss runs, that itself tells you something. Building a solid enterprise HR cost baseline before evaluating providers makes this entire process more rigorous.
Step 2: Decode How Each PEO Structures Catastrophic Risk Transfer
Not all PEO insurance arrangements are built the same way, and the differences become very real when a catastrophic claim hits. There are three common structures you’ll encounter, and understanding which one you’re looking at changes everything about how you model exposure.
Fully insured master policy: The PEO pools all client employees under a single master insurance policy. Catastrophic claims are absorbed by the carrier and reinsurer behind that policy. Your renewal pricing is influenced by the broader pool’s experience, not just your company’s individual claims. For small employers, this is generally the most protective structure because a single catastrophic event doesn’t automatically crater your specific rates.
Large-deductible or loss-sensitive programs: Here, the PEO structures coverage with a large deductible layer or a retrospective rating adjustment. You pay a base premium, but if your claims exceed certain thresholds, you get billed back for losses within your deductible layer. Catastrophic claims don’t disappear — they flow back into your cost basis through retro adjustments, sometimes 12 to 24 months after the claim occurs. Understanding how to model large deductible workers’ comp costs through a PEO is critical for evaluating these programs accurately.
Hybrid arrangements: Some PEOs use a combination — fully insured for certain lines, loss-sensitive for others, with client-level experience adjustments baked into renewal methodology. These are the hardest to evaluate because the risk transfer isn’t clean in either direction.
For each proposal you’re evaluating, you need to identify where catastrophic risk actually sits. Is it absorbed by the PEO’s master carrier? Transferred to a reinsurer? Or does it flow back to you through retro billing or experience rating? Ask this directly. A good PEO should be able to explain their stop-loss structure, their per-occurrence caps, and what triggers a claim being classified as catastrophic within their program.
Also ask about aggregate limits at the carrier level. PEOs typically carry catastrophic reinsurance behind their master policies, but the attachment points and exclusions on that reinsurance determine how much risk actually transfers away from the client pool. If the PEO’s reinsurance attaches at a level well above typical catastrophic claims, more of that risk stays in the pool — and more of it can influence your pricing.
Red flag worth noting: if a PEO’s sales team can’t clearly articulate their stop-loss structure, deflects questions about large-loss handling, or tells you “don’t worry, it’s all covered” without specifics, that’s a signal. Understanding the workers’ comp claims cost containment approach each PEO uses will help you evaluate these answers more critically.
Step 3: Build Scenario Models for Single Large-Loss Events
This is where the modeling actually starts. You’re going to create three scenarios and trace the financial path through each PEO’s structure.
Scenario A: Severe workers’ comp claim ($250K–$500K). Think a serious fall injury, a machinery accident, or a back injury requiring surgery and extended rehabilitation. This is the most common catastrophic event for businesses in physical industries.
Scenario B: Catastrophic health event ($500K+). A premature birth, a cancer diagnosis requiring aggressive treatment, or a major cardiac event. These happen across every industry, and they can hit a small employer’s health plan hard.
Scenario C: Multi-claimant incident. A workplace accident affecting several employees simultaneously — a vehicle accident, a structural failure, an exposure event. The total claim may be moderate per individual but significant in aggregate.
For each scenario, build a simple spreadsheet. Set up columns for each PEO provider you’re evaluating. Set up rows for: the total claim amount, what the carrier absorbs under their structure, what hits the master policy aggregate, what flows back to your cost basis through retro or experience rating, the timing of when that cost hits you, and the net effect on your renewal rates. If you need a structured framework, a PEO cost variance analysis can help you organize these comparisons systematically.
The timing column is especially important. In a loss-sensitive program, a catastrophic workers’ comp claim in March might not show up in your retro adjustment until the following year’s audit. You need to understand the cash flow impact, not just the total cost. A $300,000 retro billing 18 months after the claim can create a serious liquidity problem if you weren’t modeling for it.
For the health side, trace how a catastrophic claim interacts with the specific stop-loss attachment in each PEO’s group health plan. If one PEO has a specific stop-loss at $75,000 per claimant and another has it at $150,000, your exposure on Scenario B looks very different between those two proposals.
Keep the spreadsheet simple. You’re not trying to build an actuarial model. You’re trying to create a side-by-side comparison that makes the financial differences visible. Even rough estimates based on each provider’s stated structure will surface meaningful differences in exposure.
Step 4: Stress-Test Aggregate Exposure Across Your Entire Claims Portfolio
Single large-loss modeling tells you about peak exposure. Aggregate modeling tells you about total exposure — and this is where many business owners get caught off guard.
Most PEO health arrangements include both specific stop-loss and aggregate stop-loss. Specific covers any one claimant exceeding the attachment point. Aggregate caps your total claims liability across all employees for the year. The problem is that routine claims erode your aggregate buffer throughout the year, and if a catastrophic event hits after that buffer is already depleted, your exposure is higher than you’d expect.
This is called corridor risk. It’s the gap between your specific stop-loss attachment and your aggregate limit, and it’s where multiple moderate claims can create catastrophic-level total exposure even without a single massive event. Picture a year where you have five claims between $40,000 and $80,000 — none of which trigger specific stop-loss — followed by a $300,000 claim in Q4. Depending on where your aggregate sits, you may be carrying far more of that Q4 claim than the proposal summary suggested.
To stress-test this, layer your historical claims frequency on top of each PEO’s aggregate structure. Take your average annual claims count and dollar volume from your baseline data in Step 1. Run it through each provider’s aggregate model and see how much aggregate buffer remains at various points in the year before a catastrophic event occurs. A thorough workers’ comp claims frequency analysis can provide the historical data foundation you need for this exercise.
This is also where loss-sensitive PEO arrangements can produce dramatically different outcomes than fully insured models. In a fully insured master policy, your aggregate exposure is largely fixed. In a loss-sensitive program, the aggregate calculation may shift based on actual claims development, meaning your worst-case scenario isn’t a fixed number — it’s a moving target tied to how the year unfolds.
Ask each PEO for their aggregate calculation methodology in writing. How is the aggregate limit set? Is it based on expected claims, a fixed multiple of premium, or something else? What happens if you exceed it? Learning how to forecast your PEO costs across multiple scenarios makes these aggregate stress tests far more actionable.
Step 5: Quantify the Renewal and Long-Tail Pricing Impact
A catastrophic claim doesn’t just cost you money in the year it happens. It reshapes your cost structure for the next two to three years, sometimes longer. This is the part of the analysis most businesses skip because it requires thinking beyond the current proposal.
On the workers’ comp side, catastrophic claims affect your Experience Modification Rate, commonly called EMR or mod. Your EMR is calculated based on your claims history compared to expected losses for your industry and payroll size. A large loss in year one feeds into your mod calculation for three subsequent years, typically excluding the most recent year. Depending on the size of the claim and whether the PEO’s experience rating formula includes a large-loss cap, a single catastrophic event can push your mod significantly above 1.0, increasing your workers’ comp costs for years.
Ask each PEO directly: does your experience rating formula include a large-loss cap or limitation on how much a single claim feeds into the client’s renewal pricing? Some PEO carriers cap individual claim weighting at a defined threshold — say $100,000 or $150,000 — which limits how much a catastrophic event reprices your account. Others use full actual losses, meaning a $400,000 claim hits your experience rating at full value. Understanding how to reduce your experience modification factor through strategic PEO selection is one of the most impactful long-term cost decisions you can make.
On the health side, catastrophic claims affect your medical loss ratio within the PEO’s group health program. If you’re in a fully pooled master policy, one catastrophic claimant has limited impact on your specific renewal. If you’re in a smaller pool or a carve-out arrangement, the MLR impact can be significant.
Build a multi-year total cost of ownership model for each provider. Year one pricing is only part of the picture. A PEO with slightly higher admin fees but a large-loss cap in their experience rating formula may cost meaningfully less over three years than a competitor with lower upfront fees and full loss credibility at renewal.
Also check for rate guarantees. Some PEOs offer contractual protections against catastrophic claim repricing — a rate cap or a guarantee period that limits how much your costs can increase post-claim. Others don’t. That distinction belongs in your model.
Step 6: Pressure-Test Provider Answers Against the Actual Contract
Everything you’ve modeled in the previous steps is only as good as what’s actually in the contract. This step is about closing the gap between what the sales team told you and what you’re actually agreeing to.
Start by cross-referencing the verbal representations you received about catastrophic coverage against the service agreement and the underlying insurance policy documents. Verbal assurances mean nothing if the contract language says otherwise. This isn’t cynicism — it’s standard practice in any significant commercial arrangement.
Specifically, look for these clauses:
Large-loss exclusions: Some service agreements include language that allows the PEO to exclude catastrophic claims from the standard pricing structure or to reclassify them as extraordinary events subject to separate billing.
Retro adjustment triggers: If you’re in a loss-sensitive program, the contract should define exactly what triggers a retro billing, how it’s calculated, and when it’s due. Vague language here is a red flag.
Aggregate corridor definitions: How does the contract define the aggregate limit? Is it fixed or variable? What’s the calculation basis? What happens when you exceed it?
Termination provisions tied to claims experience: Some PEO agreements include clauses that allow the provider to terminate the relationship or significantly reprice if your claims experience exceeds certain thresholds. Read these carefully. A PEO that can exit when your claims get bad is transferring risk back to you in a particularly painful way. Conducting a thorough termination clause risk analysis before signing can protect you from these scenarios.
Beyond the contract, request a claims-handling protocol document. You want to understand who manages catastrophic claims, what the escalation process looks like, and how the PEO’s TPA or carrier handles reserving on large losses. Reserving matters because inflated reserves on an open catastrophic claim can affect your experience rating even before the claim closes. Knowing how to track and verify workers’ comp accounting through your PEO gives you the tools to catch reserving issues early.
If the contract language is vague or silent on catastrophic exposure, that ambiguity favors the PEO. Always. Ask for clarifying addenda or written confirmation of verbal representations before you sign. If a provider is unwilling to put their catastrophic coverage commitments in writing, you have your answer about where the risk actually sits.
Putting the Model to Work
If you’ve worked through these six steps, you now have something most businesses never build before signing a PEO agreement: a clear, comparable picture of worst-case financial exposure across providers.
Use this as your final checklist before making a decision. Baseline exposure documented. Risk transfer structures decoded for each provider. Single-loss and aggregate scenarios modeled. Renewal tail costs projected across years two and three. Contract language validated against verbal representations.
The provider that looks cheapest on a per-employee basis may carry the highest catastrophic exposure. The one with slightly higher admin fees might fully insulate you from large-loss repricing. That tradeoff only becomes visible when you model it. Surface-level proposal comparisons won’t show you this. The PEO with the slickest sales deck won’t volunteer it either.
This kind of analysis is particularly important for businesses in construction, manufacturing, healthcare, and other industries where catastrophic workers’ comp events are a realistic, not hypothetical, risk. But it matters for any employer. A single catastrophic health claim can hit a professional services firm just as hard as a job-site injury hits a contractor.
If you’re comparing PEO providers and want help building side-by-side cost models that include catastrophic exposure analysis, PEO Metrics provides the detailed, data-driven comparisons that surface these differences before you sign. Don’t auto-renew. Make an informed, confident decision.