
Year one with a PEO usually feels like a good decision. You bundled your benefits, cleaned up payroll, and got access to workers’ comp coverage that would have cost you more going direct. The math made sense. You signed.
Fast forward to year three or four. The invoice is noticeably higher. You’ve added a few employees, sure, but the per-person cost feels heavier than it used to. Nothing dramatic changed — no major claims, no new services, no conversation where someone said “we’re raising your rates.” But the number keeps climbing.
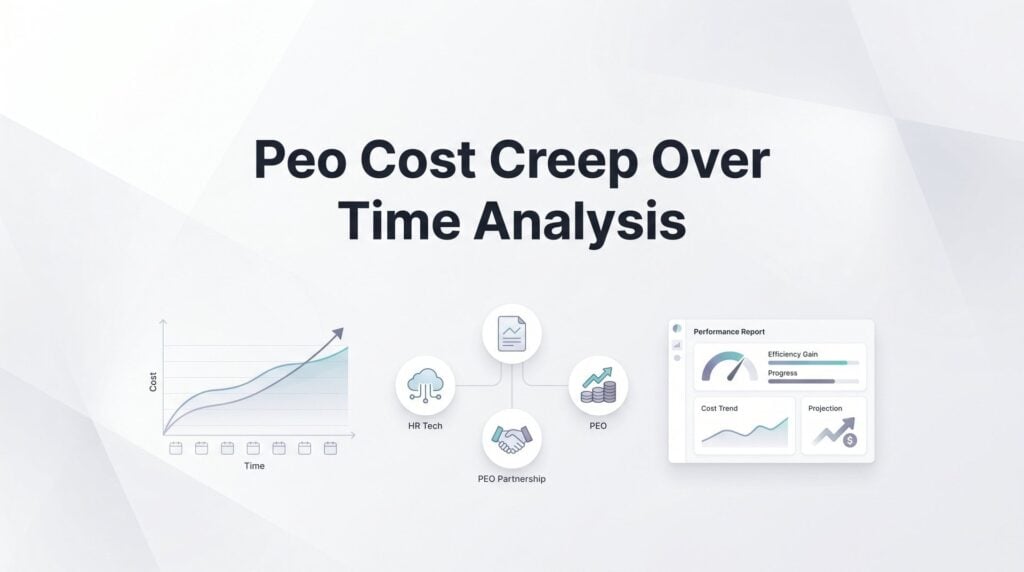
That’s PEO cost creep. It’s not a billing error. It’s not always intentional bad faith. It’s a structural feature of how most PEO pricing works, and it runs quietly in the background while you’re busy running a business. The businesses that catch it are the ones paying attention to the right numbers. Most aren’t.
This article walks through how cost creep happens mechanically, what the typical progression looks like over a multi-year PEO relationship, and how to run your own analysis before your next renewal. No fabricated benchmarks, no scary statistics pulled from nowhere — just a practical framework for figuring out whether your PEO is still a good deal or whether you’ve been drifting into overpaying territory without realizing it.
Why Your PEO Bill Keeps Climbing (Even When Nothing Changes)
The short answer: PEO pricing is built in layers, and each layer has its own escalation logic. When those layers compound together over time, the total cost grows faster than most business owners expect — and faster than any single renewal conversation makes obvious.
Start with health insurance. Your PEO bundles your employees into its master health plan and passes through the carrier’s rates. Carrier rates increase annually based on claims experience, medical inflation, and plan design changes. That part is legitimate. What’s less visible is whether your PEO is also widening its own margin on top of those carrier increases. Many PEO contracts don’t require disclosure of the spread between what the carrier charges and what the PEO bills you. You see the total; you don’t see the split.
Workers’ compensation works similarly. The PEO charges you a rate per $100 of payroll for each job classification. That rate is influenced by your experience modification factor, which shifts annually based on claims history. Legitimate changes in your experience mod will move your workers’ comp cost — that’s expected. But the PEO also maintains a spread between the rate it charges you and the rate it actually pays the carrier. That spread can widen at renewal without any explanation because most contracts don’t require the PEO to disclose it. Understanding workers’ comp cost allocation models helps you see how this pricing actually works behind the scenes.
Then there’s the admin fee. In percentage-of-payroll models, the admin fee is expressed as a percentage of your total payroll. This means every raise you give an employee automatically increases what you pay the PEO — without any additional service being delivered. If your payroll grows because you’re giving cost-of-living adjustments, merit raises, or expanding your team, your PEO’s revenue grows proportionally. The service doesn’t scale with payroll. The revenue does.
The distinction that matters here is between legitimate cost increases and margin expansion. Legitimate increases include actual claims experience driving up your workers’ comp or health costs, regulatory changes affecting compliance overhead, or genuine improvements to the service bundle you’re receiving. Margin expansion is the PEO quietly widening its spread on insurance, adding platform or technology fees that weren’t in the original agreement, or reclassifying you into a higher service tier without a meaningful change in what you’re getting. A detailed look at PEO pricing and cost structure explains how these components are typically assembled.
Most PEO contracts don’t include transparency provisions that would let you see the difference. You’re not given a baseline markup percentage at signing, so you have nothing to compare against at renewal. That’s not an accident — it’s a structural feature that makes cost creep very difficult to detect without doing your own analysis.
The Typical Cost Creep Timeline: Year One Through Year Five
PEO relationships tend to follow a recognizable pattern, and understanding the timeline helps you know when to start paying closer attention.
Year one is often the most competitive pricing you’ll see. PEOs know they’re competing for your business, so the initial quote is usually sharpened. Some providers offer implementation discounts, waived setup fees, or promotional rates on workers’ comp. You’re comparing against your previous arrangement — a broker relationship, in-house HR overhead, or a less sophisticated payroll setup — and the PEO looks favorable. This is the baseline you should be tracking against, but most businesses don’t formalize it.
Year two typically brings modest increases framed as market adjustments. Health plan renewals come through. The PEO presents the carrier’s rate increase and your new total. The increase feels reasonable — healthcare costs go up, everyone knows that — so most businesses accept it without scrutiny. What’s harder to see is whether the PEO’s own component of the bill also moved, and by how much. Learning how to forecast your PEO costs can help you anticipate what’s legitimate versus what’s margin expansion.
Years three through five are where the compounding becomes material. You’ve had multiple health renewals, each potentially carrying a hidden margin layer. Your payroll has grown, which means your percentage-of-payroll admin fee has grown with it. Your workers’ comp spread may have widened. And you may now be paying for technology or compliance features that were added to the contract incrementally — sometimes as line items, sometimes folded into the rate.
The compounding problem with percentage-of-payroll pricing deserves a closer look. Imagine you’re paying a 4% admin fee on $2 million in annual payroll. That’s $80,000 per year. Three years later, your payroll has grown to $2.6 million — a combination of new hires and merit increases. At the same 4% rate, you’re now paying $104,000. That’s $24,000 more per year for the same administrative services. The PEO didn’t do more work. Your payroll just grew.
Now layer in a half-point increase in the admin fee percentage at one of those renewals — which many businesses miss because the dollar amount increase is attributed to payroll growth — and the compounding effect accelerates further.
The reason most businesses don’t catch this: they’re comparing year-over-year rather than benchmarking against the original deal or against current market rates from other providers. A 6% increase this year feels manageable. But if you’ve had a 6% increase three years in a row, your total cost is nearly 20% higher than when you started — and the market may have moved in the other direction. Running a PEO ROI and cost-benefit analysis against your original baseline is the clearest way to see whether the relationship still makes financial sense.
Running Your Own Cost Creep Analysis: What to Actually Measure
This is the section most articles skip because it requires actual work. But it’s also the only way to know whether you have a problem or just a feeling.
The first step is pulling your PEO invoices from every year of the relationship. If you don’t have them, request them — you’re entitled to your own billing history. You want at least three years of data, ideally the full relationship. Don’t just look at annual totals. You need the invoices broken down by cost category.
The major categories to isolate are:
Admin fees: The PEO’s direct charge for HR administration, payroll processing, and related services. This may be expressed as a percentage of payroll, a flat PEPM rate, or both.
Health insurance: The total premium cost passed through from the carrier, plus any administrative or management fee the PEO adds on top. If these aren’t separated on your invoice, ask for a breakdown.
Workers’ compensation: Your total workers’ comp cost by year, broken down by classification if possible. Note any changes in your experience modification factor, which should be disclosed annually.
Technology and platform fees: Any charges for HR software, employee self-service portals, compliance tools, or reporting platforms. These sometimes appear as separate line items and sometimes get folded into the admin rate.
Once you have these categories isolated by year, calculate the percentage change in each one independently. This matters because different categories have different legitimate escalation drivers. Health insurance going up 8% in a year may reflect carrier market conditions. Admin fees going up 8% in a year with no change in services is a different conversation. A structured PEO cost variance analysis walks through exactly how to isolate these differences systematically.
The next step is normalizing for headcount and payroll growth. You want to separate what’s increasing because your business grew from what’s increasing because the PEO raised its margins. The cleanest way to do this is to calculate your effective per-employee-per-month (PEPM) cost for each year of the relationship.
To get your PEPM: take your total annual PEO cost (all categories combined), divide by 12, then divide by your average monthly headcount for that year. Do this for each year. Plot the trend line.
This single metric often reveals cost creep that’s completely invisible in annual renewal conversations. If your PEPM is rising faster than your benefits costs or the general rate of inflation, something beyond legitimate market forces is driving it. That’s your starting point for a harder conversation with your PEO — or for running a competitive comparison.
A few things to watch for in the analysis: a sudden jump in PEPM between years two and three (when introductory pricing often expires), technology fees appearing as new line items that weren’t in the original agreement, and workers’ comp costs increasing in years when your claims experience was flat or improving.
The Line Items Where Creep Hides
Not all cost creep is created equal. Some of it is visible if you’re looking. Some of it is deliberately obscured by bundled pricing. Here’s where to focus your attention.
Workers’ comp spread is one of the most common and least transparent sources of creep. The PEO charges you a rate per $100 of payroll for each job classification. The carrier charges the PEO a (lower) rate for the same coverage. The difference is the PEO’s spread — their margin on your workers’ comp. You almost certainly don’t know what that spread is, because PEOs aren’t required to disclose it in most states, and most contracts don’t include that provision. What you can track is whether your workers’ comp cost per $100 of payroll is increasing in years when your experience mod is flat or improving. If your mod goes down but your cost goes up, the spread widened. Running a workers’ comp renewal risk analysis before your contract renews can help you catch this early.
Benefits renewal markups are the second major hiding spot. When your health plan renews, the carrier raises rates based on claims experience and market factors. That’s the number your PEO presents to you. What’s harder to see is whether the PEO is also increasing its own administrative margin on the health plan at the same time. If your PEO charges a per-employee health administration fee on top of the carrier premium, watch whether that fee increases at renewal years — particularly in years when the carrier increase is already significant, because the combined impact is easy to attribute entirely to “healthcare inflation.”
Technology and platform fees are a growing source of creep that didn’t exist in many older PEO agreements. As PEOs have invested in HR software platforms, they’ve increasingly separated these costs from the core admin fee — or added them to agreements that originally didn’t include them. Sometimes this happens through a contract amendment you signed without fully noting the financial impact. Sometimes it happens at renewal when a new “enhanced” service tier is presented as the standard option. Either way, it’s worth checking whether you’re paying for platform features you actually use.
Bundled pricing is the structural problem that makes all of this hard to see. If your PEO quotes a single percentage-of-payroll rate that covers everything, you have no visibility into which component is driving increases. You can’t tell whether your admin fee went up, your workers’ comp spread widened, or a new technology fee was folded in. Requesting an unbundled cost breakdown — where each component is priced separately — is the only way to see what’s actually happening. Understanding PEO cost allocation methodology gives you the framework to interpret what an unbundled breakdown should look like. Some PEOs will provide this readily. Others will push back, which is itself useful information.
What to Do When You Find Cost Creep Before Your Next Renewal
Finding cost creep is the easy part. Doing something about it requires a bit more structure.
The first concrete step is requesting an unbundled cost breakdown from your current PEO. Ask for a written breakdown that separates admin fees, health insurance (carrier premium vs. PEO margin), workers’ compensation (your rate vs. the PEO’s carrier rate if they’ll disclose it), and any technology or platform charges. Frame it as a routine financial review — which it should be. If your PEO resists providing this information, that tells you something important about how they approach transparency.
The second step is benchmarking your effective PEPM against current market rates. Your PEPM from the analysis above is your anchor number. The question is whether it’s competitive relative to what other providers would charge for comparable services with your headcount, industry, and benefits structure. This is harder to do with sales quotes alone — sales reps quote favorably, and the comparison only becomes meaningful when you’re comparing against actual structured data. A PEO vs internal HR cost modeling exercise can help you understand whether your current arrangement still beats the alternatives.
The third step is using that data as leverage. If you’ve found material cost creep and you have market data to support it, you have a real negotiating position at renewal. PEOs prefer to retain clients — switching costs are real for both sides. A well-documented analysis showing that your effective cost has increased significantly while comparable market rates haven’t moved proportionally is a reasonable basis for renegotiating your admin fee, your workers’ comp rate, or both.
The harder question is when creep signals it’s time to switch rather than negotiate. A few indicators: if your PEO won’t provide an unbundled cost breakdown after a direct request, if multiple cost categories have increased simultaneously without clear explanation, or if your PEPM has grown substantially over the relationship while your service experience hasn’t improved. Opacity about pricing is often a stronger signal than the cost creep itself — if they won’t show you the math, you can’t trust the number. Building a PEO scenario analysis financial model lets you map out the cost implications of staying, renegotiating, or switching providers.
Running a side-by-side comparison with other providers using actual data — not just introductory sales quotes — is the most effective way to pressure-test whether your current arrangement is still competitive. It also gives you a credible alternative to bring to renewal negotiations, which changes the dynamic considerably.
The Bottom Line on PEO Cost Creep
PEO cost creep isn’t a scam. It’s a structural feature of how most PEO pricing works, and it benefits from your inattention. The pricing models are built in ways that generate automatic revenue growth as your business grows, and the lack of transparency provisions in most contracts means there’s no natural forcing function for the PEO to justify its margin over time.
The businesses that avoid overpaying are the ones that treat their PEO relationship like any other significant vendor relationship: they track costs over time, they benchmark regularly, and they don’t let renewals happen on autopilot.
Start with the PEPM analysis described here. Pull three to five years of invoices, isolate the major cost categories, normalize for headcount, and plot the trend. That single exercise will tell you more than any renewal conversation your PEO sales rep initiates. If the trend line looks wrong, you’ll have the data to back up that instinct.
From there, the next step is getting actual market comparison data — not sales pitches, but structured side-by-side pricing and service breakdowns that let you see where you stand relative to current alternatives.
Don’t auto-renew. Make an informed, confident decision. Before you sign that next renewal, make sure you’re comparing your current arrangement against real market data. PEO Metrics provides unbiased, side-by-side provider comparisons with detailed pricing breakdowns — so you can see exactly what you’re paying for and whether a better arrangement exists. Many businesses find the analysis pays for itself many times over. The ones that don’t bother are the ones still paying year-five prices for year-one value.