
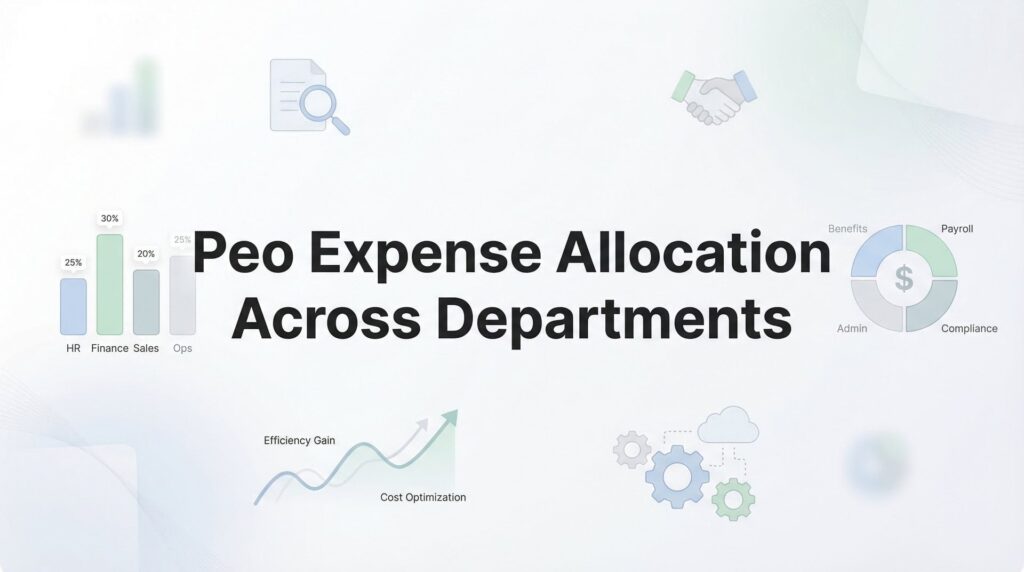
Most businesses treat their PEO invoice as a single line item—one big number that hits the books each month. That works fine until your CFO asks why the sales team’s labor costs look identical to engineering’s, or until department heads start questioning whether they’re subsidizing other teams’ benefits.
The reality is that PEO costs aren’t uniform across your organization. Different departments have different headcounts, salary levels, benefits utilization patterns, and workers’ comp risk profiles. Lumping everything together obscures these differences and makes it nearly impossible to understand true departmental profitability.
This guide walks through a practical approach to breaking down your PEO expenses and allocating them accurately across departments. We’re not talking about theoretical accounting exercises—this is about building a system that gives you real visibility into where your HR dollars actually go.
Whether you’re running a 25-person company with three departments or a 200-person operation with a dozen cost centers, the principles are the same. The goal isn’t perfect precision (that’s impossible with bundled PEO pricing) but rather reasonable accuracy that supports better business decisions.
Step 1: Break Down Your PEO Invoice Into Component Categories
Your first task is understanding what you’re actually paying for. Most PEO invoices arrive as summary documents with high-level totals that tell you almost nothing about underlying cost drivers.
Start by identifying the major cost buckets. Typically these include admin fees, payroll taxes, workers’ comp premiums, health insurance, retirement contributions, and ancillary services. Some PEOs break these out clearly. Others bury them in vague line items like “HR services” or “employee benefits.”
If your invoice doesn’t provide adequate detail, request a breakdown from your PEO account manager. Most providers can furnish this—they just don’t volunteer it unless you ask. You want visibility into what percentage of your total cost goes to each category.
Next, separate fixed costs from variable costs. Per-employee admin fees are fixed—you pay the same amount whether that employee earns $40,000 or $140,000. Percentage-based fees and claims-driven premiums are variable—they fluctuate based on payroll levels and actual utilization.
This distinction matters because fixed and variable costs allocate differently across departments. A department with high salaries but low headcount will bear more variable costs but fewer fixed costs than a department with the opposite profile.
Flag any bundled line items that resist easy categorization. Some PEOs combine admin fees with compliance services, or blend workers’ comp with general liability. These bundled items need further decomposition before you can allocate them accurately. If your PEO can’t or won’t break them down, you’ll need to make reasonable assumptions and document them.
Create a simple table that lists each cost category, the monthly amount, whether it’s fixed or variable, and the allocation basis you’ll use. This becomes your reference document for all subsequent steps.
The effort you put into this step determines the quality of everything downstream. Garbage in, garbage out. If you start with a murky understanding of your cost structure, your departmental allocations will be equally murky. Understanding how to track and account for benefits expenses under a PEO arrangement provides a solid foundation for this breakdown work.
Step 2: Map Employees to Cost Centers
Accurate allocation requires knowing which employees belong to which departments. Sounds obvious, but messy data kills allocation accuracy faster than anything else.
Build a clean employee roster with department assignments. Pull this from your HRIS if possible, or create it manually if you’re small enough. Each employee needs a clear home department—no ambiguity.
Now handle the edge cases. Employees who legitimately split time across departments need a documented split percentage. If your marketing manager spends 60% of her time on brand and 40% supporting sales, record that. Don’t default to 50/50 just because it’s easy.
Decide how to treat contractors processed through your PEO. Some businesses allocate contractor costs to the department that requested the work. Others create a separate “contingent workforce” category. Either approach works as long as you’re consistent.
Shared roles present a trickier question. Your HR team, finance team, and executive leadership don’t belong to any single operating department. You have three options: create an “overhead” or “corporate” department, allocate these roles proportionally across all departments based on headcount or payroll, or split them based on estimated service consumption.
There’s no universally correct answer. Smaller companies often find the overhead approach cleaner—it keeps departmental P&Ls focused on operating activities. Larger companies may prefer proportional allocation to ensure all costs flow through to departments.
The critical piece is establishing a process for keeping this mapping current. People transfer between departments, new hires join, employees leave. If your allocation model relies on stale department assignments, your results become unreliable quickly. A robust PEO HR technology platform can help automate this tracking and reduce manual data management.
Set a monthly reminder to review and update your employee-to-department mapping. This takes fifteen minutes if you stay on top of it, or half a day if you let it slip for six months.
Step 3: Assign Direct Costs to Individual Employees
Some PEO costs tie directly to individual employees and should be allocated that way rather than spread across departments using blunt formulas.
Health insurance premiums are the clearest example. An employee with family coverage costs you dramatically more than an employee with single coverage. A department with lots of young, single employees will have lower per-capita health costs than a department full of employees covering spouses and children.
Pull actual premium data for each employee from your PEO. Most providers can give you a monthly report showing who’s enrolled in what plan and what each plan costs. Assign these premiums directly to individuals, then roll them up to departments. Understanding how PEO benefits administration works helps you know exactly what data to request.
Retirement contributions work the same way. If you offer a 401(k) match, the cost varies based on each employee’s salary and participation rate. A senior engineer who maxes out their match costs you more than a coordinator who contributes minimally. Track actual match amounts per employee and allocate accordingly.
Workers’ comp is trickier because PEOs often blend rates across job classifications. But the underlying cost drivers are real—your warehouse team generates more workers’ comp expense than your accounting team.
Request job classification codes and associated rates from your PEO. If they can’t provide this level of detail (some won’t), you’ll need to estimate based on industry benchmarks. A forklift operator might carry a workers’ comp rate of $8 per $100 of payroll while a desk worker carries $0.50 per $100. Learning how to track and verify workers’ comp accounting through your PEO makes this process significantly easier.
Build a per-employee cost profile that captures these direct costs. You should be able to look at any individual employee and see their monthly burden: base salary plus taxes plus health premium plus retirement match plus workers’ comp allocation.
When these individual profiles roll up to departments, you get a much clearer picture of true cost differences. You’ll often find that the department you thought was expensive actually isn’t—it just has more family health coverage or higher-risk job classifications.
Step 4: Distribute Shared and Administrative Costs
After assigning direct costs, you’re left with shared expenses that don’t tie cleanly to individuals. PEO admin fees, platform charges, compliance services, and various other line items benefit the entire organization.
You need an allocation method. The three most common approaches are per-headcount, percentage-of-payroll, and hybrid.
Per-headcount allocation is simplest. If you pay $15,000 monthly in admin fees and have 50 employees, each department gets charged $300 per employee. This works well when admin burden correlates with employee count rather than compensation levels.
Percentage-of-payroll allocation ties costs to salary. If your engineering department represents 40% of total payroll, they bear 40% of admin costs. This makes sense when you believe higher-paid employees consume more PEO services, or when you want cost allocation to mirror revenue contribution.
The hybrid approach uses headcount for some costs and payroll percentage for others. You might allocate basic admin fees per-headcount but distribute compliance services based on payroll. This adds complexity but can produce more accurate results.
Document your methodology in writing. Your allocation approach should be defensible and consistent period-over-period. If you switch methods every quarter, you’ll create confusion and undermine confidence in your numbers.
Consider whether certain departments should bear higher admin costs based on actual service utilization. A sales team with 40% annual turnover consumes more onboarding, offboarding, and benefits administration than a stable engineering team. Some businesses build this into their allocation by applying different per-employee rates to high-touch departments.
This introduces subjectivity, so proceed carefully. The benefit of more accurate cost assignment needs to outweigh the cost of additional complexity and potential internal pushback. Knowing how to benchmark your PEO expenses helps you validate whether your allocation results fall within reasonable ranges.
Step 5: Build Your Allocation Model in a Maintainable Format
You’ve defined your cost categories, mapped employees to departments, and chosen allocation methods. Now you need a system that makes monthly updates manageable rather than painful.
The fundamental choice is spreadsheet versus accounting system integration. Spreadsheets offer flexibility and transparency—anyone can open the file and see exactly how costs flow. Accounting system integration offers automation and eliminates manual data entry.
For companies under 100 employees, a well-structured spreadsheet usually wins. You’ll spend a few hours building it initially, then 30-60 minutes monthly keeping it current. The transparency benefits outweigh the modest time investment.
Larger companies should explore accounting system integration, particularly if you’re already running departmental P&Ls through your general ledger. Many accounting platforms can import PEO invoices, apply allocation rules, and post entries automatically.
Regardless of format, structure your model so monthly updates require minimal manual work. Hard-code your allocation rules and employee-to-department mappings in one place. Monthly variables—new invoice amounts, payroll totals, employee changes—should be the only things you touch each cycle. Understanding how to handle PEO payroll accrual adjustments ensures your model stays synchronized with actual cash flows.
Include validation checks that flag when allocations don’t sum to actual invoices. If your PEO bill is $85,000 but your departmental allocations total $83,500, something’s wrong. Build formulas that highlight these discrepancies immediately rather than letting them hide.
Create summary views that department heads can actually understand. Your VP of Sales doesn’t need to see every allocation formula—she needs a clean report showing her team’s total PEO costs broken down by major category, with month-over-month and year-over-year comparisons.
The best allocation model is the one that actually gets used. If yours requires a finance degree to interpret, it won’t drive better decisions.
Step 6: Validate Results and Adjust for Reasonableness
You’ve built your allocation model and run the numbers. Before distributing results, validate that they pass basic reasonableness tests.
Compare allocated costs to industry benchmarks for labor burden by department type. Engineering teams typically carry total burden (salary plus benefits plus taxes plus admin) of 1.25-1.4x base salary. Sales teams often run slightly lower due to younger demographics and higher turnover. Back-office functions land somewhere in the middle.
If your allocation shows engineering at 1.7x or sales at 1.1x, investigate. You may have a genuine cost difference that warrants explanation, or you may have an allocation error.
Identify outliers and trace them back to root causes. If one department’s per-employee health insurance cost is 50% higher than others, is that because they have more family coverage, or did you accidentally double-count something?
Get buy-in from department heads before finalizing. Schedule a quick review meeting where you walk through the methodology and results. Department leaders will spot issues you missed—they know their teams better than you do.
This review also builds trust in the numbers. If department heads understand how costs were allocated and had opportunity to raise concerns, they’re more likely to accept the results even when those results are unfavorable. Building a building a PEO savings estimate can help contextualize these costs against the value your PEO delivers.
Establish a quarterly review cadence to catch drift and update assumptions. Benefits costs shift during open enrollment. Headcount changes. Workers’ comp rates adjust. Your allocation model needs periodic recalibration to stay accurate.
Don’t chase perfection. If your allocated costs are within 5% of actual invoices and the departmental splits make intuitive sense, you’re done. Further refinement delivers diminishing returns.
Putting It All Together
Getting PEO expense allocation right isn’t about accounting perfection—it’s about having good enough data to make informed decisions. Once you’ve worked through these steps, you’ll have visibility into which departments are actually driving your HR costs and whether those costs are reasonable for what you’re getting.
Quick checklist before you call it done: Invoice broken into component categories? Employee-to-department mapping current and clean? Direct costs assigned to individuals where possible? Shared costs allocated using a documented, defensible method? Model structured for easy monthly updates? Results validated against benchmarks and reviewed by stakeholders?
If you’re finding that your PEO’s billing structure makes accurate allocation nearly impossible, that’s worth a conversation with your provider—or a data point for your next PEO evaluation. Some PEOs are simply better at supporting client reporting needs than others.
The transparency you’ve built also positions you to ask better questions during renewal discussions. When you know exactly what you’re paying for health insurance versus admin fees versus workers’ comp, you can negotiate more effectively and spot when proposed rate increases don’t match your actual cost drivers.
Before you sign that PEO renewal, make sure you’re not leaving money on the table. Many businesses unknowingly overpay because of bundled fees, hidden administrative markups, and contracts designed to limit flexibility. We give you a clear, side-by-side breakdown of pricing, services, and contract terms—so you can see exactly what you’re paying for and choose the option that truly fits your business. Contact our team