
Most businesses signing a PEO contract have no idea whether their per-employee costs are competitive, inflated, or hiding margin that could be negotiated down. The problem isn’t a lack of PEO options. It’s a lack of financial visibility.
PEO financial benchmarking tools solve this by giving you concrete data to compare what you’re paying (or being quoted) against what similar companies actually pay. Some tools focus narrowly on pricing transparency, others bundle benchmarking into broader HR analytics, and a few are purpose-built for the PEO evaluation process.
This list covers eight tools that approach PEO financial benchmarking from different angles. We prioritized tools that surface real cost comparisons, expose hidden fees, or give you leverage during PEO negotiations — not just dashboards that look impressive but lack actionable pricing data. Whether you’re evaluating your first PEO or auditing a renewal quote, these are the tools worth your time.
1. PEO Metrics
Best for: Businesses that want unbiased, side-by-side PEO cost comparisons before signing or renewing
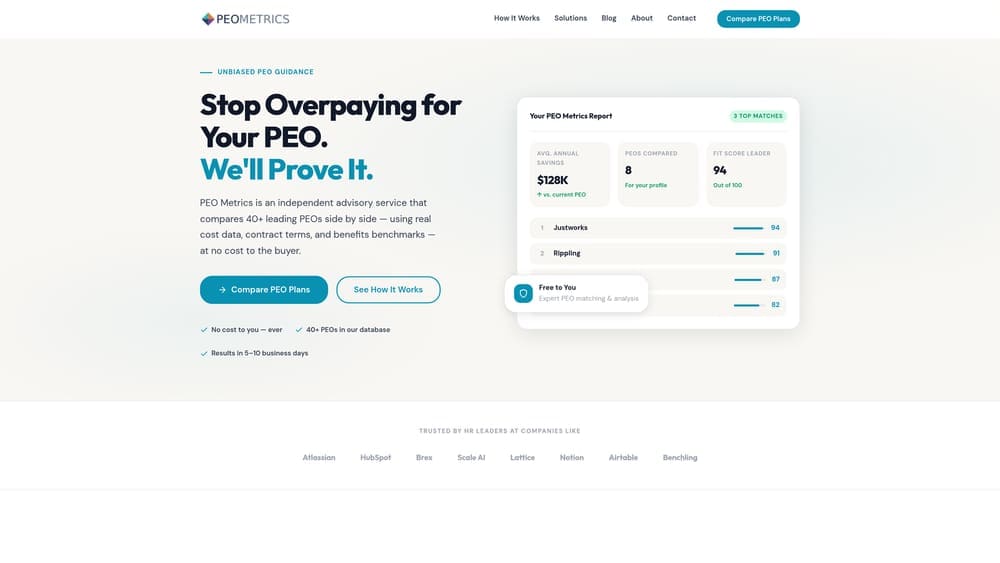
PEO Metrics is a purpose-built PEO comparison platform that gives businesses granular financial benchmarking across multiple PEO providers in one place.
Where This Tool Shines
Most businesses evaluate PEOs through broker conversations or vendor sales calls — neither of which gives you an unbiased view of what you’re actually paying for. PEO Metrics is built specifically to close that gap. It’s not affiliated with any single PEO, which matters more than it might seem. When a broker recommends a PEO, they often have commission incentives baked in. PEO Metrics doesn’t.
The platform goes beyond surface-level pricing. You can break down admin fees, workers’ comp rates, and benefits costs separately — which is exactly where the hidden margin tends to live in PEO contracts. That level of granularity is hard to replicate with general HR analytics tools or DIY spreadsheets.
Key Features
Side-by-Side Provider Comparisons: Compare PEO costs across multiple providers simultaneously with detailed pricing breakdowns rather than ballpark estimates.
Unbiased Benchmarking: No provider affiliations or commission structures influencing the data you see.
Fee Transparency: Separate breakdowns of admin fees, workers’ comp costs, and benefits pricing so you know exactly where your money goes.
Negotiation Support: Data-driven guidance designed to give you real leverage when negotiating a new contract or challenging a renewal quote.
Best For
Companies actively shopping for a PEO, businesses approaching a renewal who want to pressure-test their current pricing, and HR leaders who need hard data to present to finance or executive leadership before committing to a contract.
Pricing
Consultation-based model. Contact PEO Metrics directly for pricing — the engagement is scoped around your specific company size and evaluation needs.
2. NAPEO Benchmarking Reports
Best for: Establishing macro-level baseline expectations before evaluating specific PEO providers
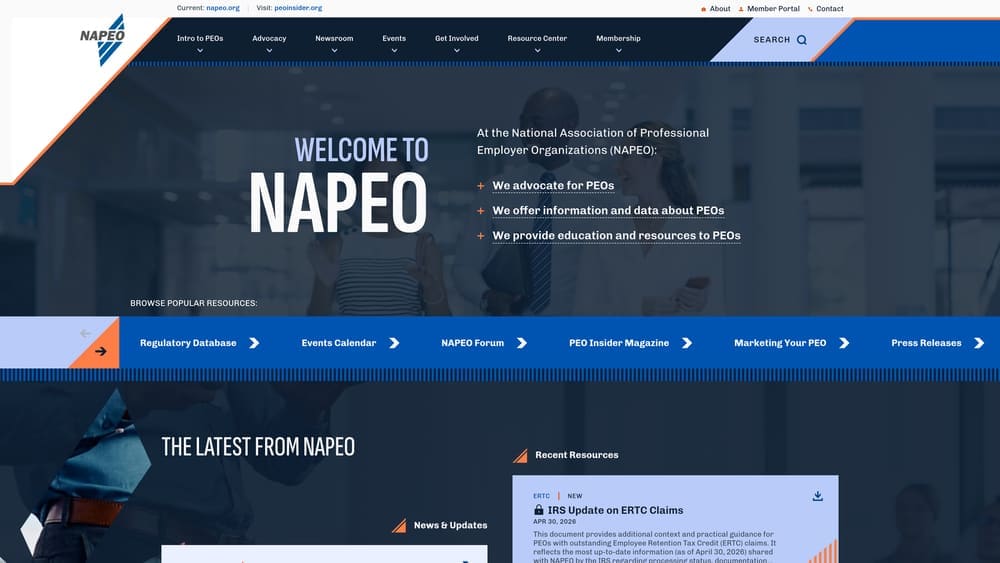
NAPEO is the National Association of Professional Employer Organizations, and its periodic benchmarking reports are the closest thing the industry has to standardized financial data.
Where This Tool Shines
NAPEO reports are genuinely useful for understanding where the PEO industry is trending — cost growth, service adoption rates, and aggregate financial performance across member organizations. If you’re walking into a PEO conversation cold, reading a NAPEO report first gives you a credible foundation for what “normal” looks like at the industry level.
The limitation is real though: NAPEO data is aggregated across member PEOs, which means it tells you what the industry looks like broadly, not what a specific provider will charge your company specifically. Think of it as the 30,000-foot view. Useful context, but not negotiation leverage on its own.
Key Features
Industry Aggregate Data: Financial and operational data sourced from NAPEO member PEOs, giving a broad market view.
Macro Cost Trends: Tracks industry-level cost movements over time, useful for spotting whether PEO pricing is rising or stabilizing.
Baseline Expectations: Helps you enter PEO conversations with a grounded sense of what’s typical before providers start quoting you.
Best For
HR leaders and finance teams doing initial PEO research who want industry-level context. Also useful for internal presentations where you need credible third-party data to justify the PEO evaluation process itself.
Pricing
Some reports are free for NAPEO members. Others are available for purchase. Non-members may have limited access depending on the report type.
3. Paychex PEO Analytics Dashboard
Best for: Current Paychex PEO clients who want to track cost trends over time within their existing relationship
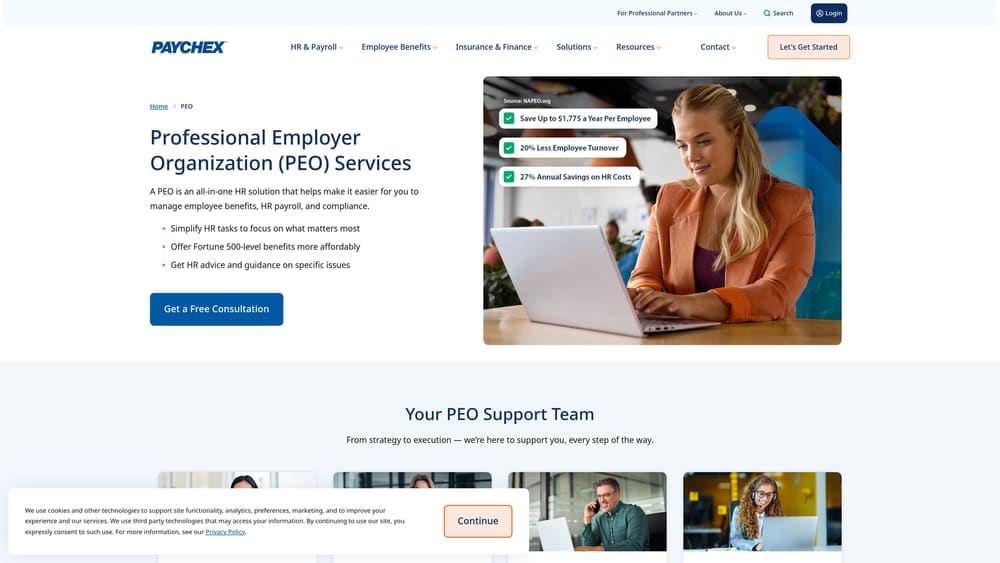
Paychex PEO includes built-in analytics and reporting tools that allow clients to monitor cost trends, workforce composition, and payroll metrics without a separate platform.
Where This Tool Shines
If you’re already a Paychex PEO client, this is your lowest-friction option for internal cost tracking. No additional vendor, no integration headaches, no extra software cost. The dashboard surfaces payroll trends, benefits costs, and workers’ comp data in one place, which is genuinely useful for year-over-year analysis.
The honest limitation here is the same one that applies to any PEO’s built-in analytics: it benchmarks you against Paychex’s own client pool, not the broader market. So you might learn that your costs are average for a Paychex client — but that doesn’t tell you whether Paychex’s pricing is competitive relative to other PEOs. For that, you need an external tool.
Key Features
Integrated Reporting: Analytics are embedded within the Paychex platform — no separate login or data export needed.
Cost Trend Tracking: Monitor payroll, benefits, and workers’ comp costs over time to catch unexpected increases early.
Workforce Metrics: Headcount reporting and workforce composition data alongside financial figures.
No Additional Cost: Included as part of the Paychex PEO service.
Best For
Paychex PEO clients who want internal visibility into their cost trends. Not the right tool if your goal is cross-provider benchmarking or evaluating whether to leave Paychex for another provider.
Pricing
Included with Paychex PEO service. No separate tool cost for existing clients.
4. ADP TotalSource Workforce Benchmarking
Best for: ADP TotalSource clients who need enterprise-grade analytics and compensation benchmarking within their existing platform
ADP TotalSource includes workforce benchmarking capabilities backed by one of the largest payroll and HR datasets in the industry.
Where This Tool Shines
ADP’s scale is its biggest asset here. Because ADP processes payroll for an enormous share of the U.S. workforce, the benchmarking data it can pull is genuinely broad. Compensation comparisons, turnover rates, and benefits cost data can be filtered by industry, region, and company size — which is more granular than most PEO-embedded analytics tools offer.
That said, the same structural limitation applies as with Paychex: this is ADP benchmarking you against ADP’s client base. It’s a useful internal lens, but it won’t tell you whether another PEO could deliver equivalent services for less. If you’re approaching a TotalSource renewal and want to pressure-test the pricing, you’ll need external data to do that honestly.
Key Features
Large Dataset Benchmarking: Access to ADP’s multi-industry client data for compensation and benefits comparisons.
Customizable Reports: Filter benchmarking data by industry, geography, and company size for more relevant comparisons.
Compensation and Turnover Analysis: Goes beyond cost tracking to include workforce stability metrics.
Platform Integration: Fully embedded within ADP’s HR and payroll ecosystem — no separate data pulls required.
Best For
Mid-market and enterprise companies already on ADP TotalSource that need structured workforce analytics and compensation benchmarking as part of their ongoing HR operations.
Pricing
Included with ADP TotalSource PEO. Custom pricing based on headcount — contact ADP directly for a quote.
5. Sequoia Consulting Group – Total Comp Benchmarking
Best for: Tech companies and venture-backed startups evaluating whether their PEO benefits packages are competitively priced
Sequoia Consulting Group is a benefits and total compensation benchmarking platform with a particularly strong dataset in the tech and startup ecosystem.

Where This Tool Shines
Sequoia’s strength is depth on the benefits side. If you’re trying to understand whether your PEO’s medical, dental, or equity compensation packages are actually competitive for your talent market, Sequoia has the data to answer that. Their dataset skews toward tech and venture-backed companies, which makes it especially relevant if you’re competing for engineering or product talent where total comp expectations are high.
It’s worth being clear about what Sequoia is and isn’t. It’s not a PEO comparison tool. It’s a total compensation benchmarking service that can inform your PEO evaluation by helping you assess whether the benefits your PEO bundles are worth what you’re paying for them. That’s a valuable but indirect use case.
Key Features
Benefits Cost Benchmarking: Deep analysis of medical, dental, and supplemental benefits costs against peer companies.
Tech Ecosystem Dataset: Particularly strong data from tech and venture-backed companies, relevant for high-growth startups.
Total Compensation Positioning: Analyzes compensation beyond base salary to include equity, benefits, and perks.
PEO Package Evaluation: Can help you determine whether PEO-bundled benefits are priced competitively for your market.
Best For
Tech companies, startups, and high-growth businesses that need to evaluate benefits competitiveness as part of a broader PEO or total compensation review. Less relevant for traditional industries or smaller businesses outside the tech ecosystem.
Pricing
Custom pricing on an engagement basis. Sequoia typically operates as a consulting relationship rather than a self-serve software subscription.
6. Salary.com (formerly Compdata Surveys)
Best for: Building bottom-up PEO cost models using granular compensation data by role, industry, and geography
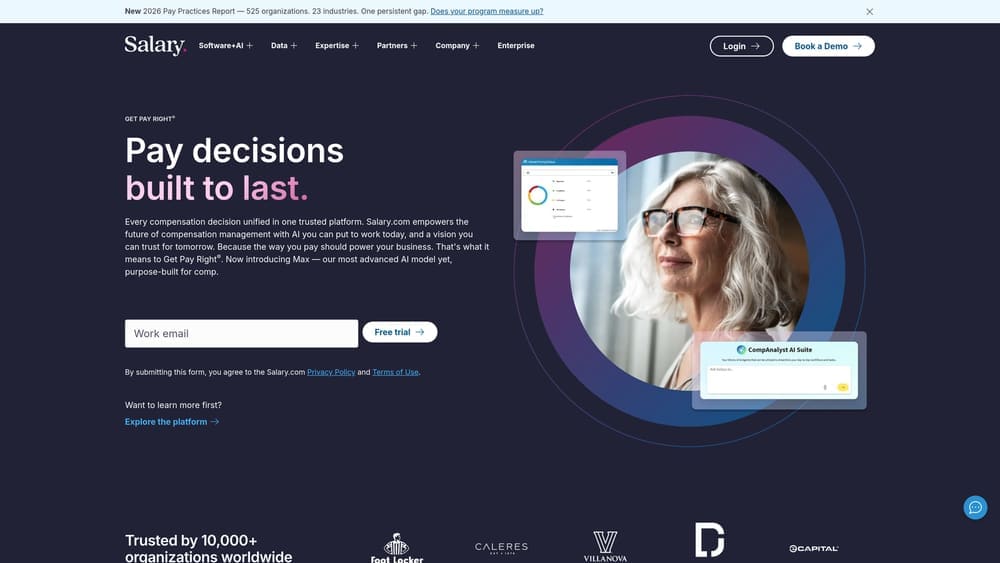
Salary.com, which acquired Compdata Surveys, provides compensation benchmarking data that can feed directly into custom PEO cost analysis frameworks.
Where This Tool Shines
Salary.com isn’t a PEO tool. But it’s genuinely useful for one specific part of the PEO evaluation process: validating whether the payroll costs bundled into your PEO quote reflect market-rate compensation for your actual workforce. If you can pull compensation data by job title, metro area, and industry, you can build a bottom-up model of what your payroll should cost — and then compare that against what your PEO is charging.
The catch is that this approach requires you to do the PEO-specific analysis yourself. Salary.com gives you the raw compensation data. You have to translate that into a PEO cost comparison, which takes time and some financial modeling comfort. It’s a strong input into a broader analysis, not a standalone benchmarking solution.
Key Features
Granular Compensation Data: Job title, industry, and metro area breakdowns for building accurate payroll cost baselines.
Broad Survey Participation: Data sourced from a wide employer base, reducing the risk of skewed or unrepresentative numbers.
Spreadsheet Integration: Data can be exported and incorporated into custom PEO cost comparison models.
Market Validation: Useful for confirming whether PEO-bundled payroll costs align with actual market compensation rates.
Best For
Finance-savvy operators and HR analysts who want to build their own PEO cost models and need reliable compensation data as a foundation. Works well paired with a DIY spreadsheet approach or as a cross-check against PEO quotes.
Pricing
Free basic access available. Premium surveys and detailed reports start around $300 and up depending on the data package.
7. Benify
Best for: Multi-location or international businesses that need cross-geography benefits cost benchmarking
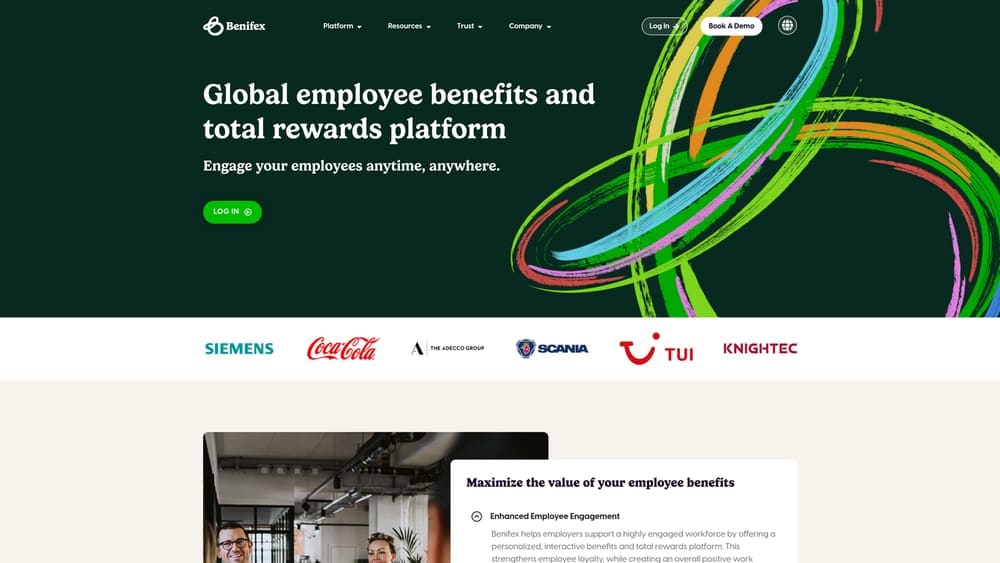
Benify is a benefits administration and analytics platform with benchmarking capabilities particularly suited to companies managing employee populations across multiple states or countries.
Where This Tool Shines
Benify’s differentiator is its multi-geography capability. Most U.S.-focused PEO benchmarking tools don’t handle international benefits analysis well. If your business has employees across multiple countries or operates in markets where benefits cost structures vary significantly, Benify gives you a way to compare costs and utilization across those populations in a structured way.
For a PEO evaluation specifically, Benify is most useful for quantifying whether your PEO’s benefits packages are actually delivering value to employees — not just whether they’re priced competitively on paper. Benefits utilization data tells you a different story than benefits cost data, and both matter when you’re deciding whether a PEO’s benefits bundle justifies its price.
Key Features
Multi-Country Benchmarking: Compare benefits costs and utilization across different geographic markets.
Utilization Analytics: Understand which benefits employees actually use, not just what’s offered.
Cost-Value Analysis: Helps quantify whether PEO benefits packages deliver measurable employee value relative to cost.
Engagement Data: Employee engagement metrics tied to benefits offerings, useful for retention analysis.
Best For
Mid-market and enterprise companies with multi-state or international workforces who need benefits benchmarking that goes beyond domestic U.S. comparisons. Less relevant for small businesses with a single-location workforce.
Pricing
Custom enterprise pricing. Contact Benify directly for a quote based on your workforce size and geographic scope.
8. Custom Spreadsheet Models (DIY Approach)
Best for: Financially savvy operators who want full control over their PEO cost comparison framework at zero software cost
Building your own PEO cost comparison model using spreadsheets and publicly available data is a legitimate approach — and it’s worth including honestly rather than pretending every business needs a paid tool.
Where This Tool Shines
The DIY spreadsheet approach wins on two dimensions: cost and customization. You can build a model that reflects exactly your cost categories, your workforce composition, and your specific PEO quotes. No vendor’s definition of “benchmarking” constrains what you measure. If you’re comparing three PEO quotes and you want to model out the five-year cost implications of each, a spreadsheet gives you complete flexibility to do that.
The honest downside is significant. Building a credible PEO cost comparison model from scratch takes time, requires you to gather data from multiple sources (NAPEO reports, Salary.com, direct PEO quotes), and needs ongoing maintenance as quotes and costs change. There’s also no automated data feed, so every update is manual. For businesses without dedicated HR analytics capacity, this approach often starts strong and gradually becomes outdated.
Key Features
Full Customization: Model exactly the cost categories and comparison dimensions that matter for your specific situation.
Zero Software Cost: No subscription, no vendor relationship — just time and data-gathering effort.
Direct Quote Integration: Incorporate actual PEO quotes side by side without reformatting for a third-party platform.
Manual Maintenance Required: No automated data feeds — every update requires hands-on effort to keep current.
Best For
Small businesses with financially analytical owners or operators, companies with limited budgets for benchmarking tools, and businesses that want to supplement a paid tool with their own custom analysis layer.
Pricing
Free. The real cost is time — building a thorough PEO cost comparison model typically requires significant effort to set up and maintain accurately.
What Is a Financial Benchmarking Platform?
A financial benchmarking platform is a tool that lets businesses compare their costs, pricing, or financial performance against external reference points — whether that’s an industry average, a peer cohort, or competitive market data. The core function is the same across industries: replace guesswork with structured data so you can see whether what you’re paying (or offering) is typical, high, or low for your situation.
In the PEO context, a financial benchmarking platform specifically helps businesses compare what they’re paying across multiple PEO providers or against what comparable companies actually pay for co-employment services. That includes per-employee-per-month (PEPM) admin fees, workers’ compensation rates, and benefits cost structures — the three areas where PEO pricing varies most and where negotiating room most often exists.
The tools on this list range from purpose-built PEO benchmarking platforms to broader HR analytics systems and compensation survey databases. What distinguishes a financial benchmarking platform from a general reporting dashboard is external reference data: it’s not just tracking your own costs over time, it’s comparing your costs against an outside standard so you know whether you have leverage at the negotiating table.
Matching the Right Tool to Your Decision Stage
The honest reality of PEO financial benchmarking is that no single tool does everything. The space is fragmented, and most businesses end up combining approaches — which is actually fine, as long as you’re intentional about it.
Here’s a practical way to think about it by where you are in the process.
If you’re doing early-stage research and need to understand what’s normal in the PEO market, NAPEO benchmarking reports give you credible industry-level context. Pair that with Salary.com data to validate compensation assumptions, and you have a reasonable foundation before talking to any PEO.
If you’re actively evaluating PEO providers and need to compare real quotes against real market pricing, that’s where a purpose-built tool like PEO Metrics earns its value. The side-by-side cost breakdowns and unbiased positioning are specifically designed for this moment — when you’re trying to figure out whether a quote is competitive or whether there’s room to negotiate.
If you’re already inside a PEO relationship and want internal cost tracking, the built-in analytics from ADP TotalSource or Paychex PEO are the path of least resistance. Just be clear-eyed about their limitation: they benchmark you against their own client pool, not the broader market.
If your workforce spans multiple geographies or you need to evaluate benefits cost efficiency specifically, Sequoia and Benify fill that gap in ways general PEO tools don’t.
And if you have the time and analytical comfort to build your own model, the DIY spreadsheet approach is a legitimate option — especially as a complement to other tools rather than a replacement for them.
The combination that gives you the most leverage before a PEO signing or renewal: external benchmarking data from a tool like PEO Metrics to establish market-rate pricing, paired with your own cost model that reflects your specific workforce composition. That combination is hard for a PEO to argue with across the table.
Before you sign that PEO renewal, make sure you’re not leaving money on the table. Many businesses unknowingly overpay because of bundled fees, hidden administrative markups, and contracts designed to limit flexibility. Don’t auto-renew. Make an informed, confident decision.
