
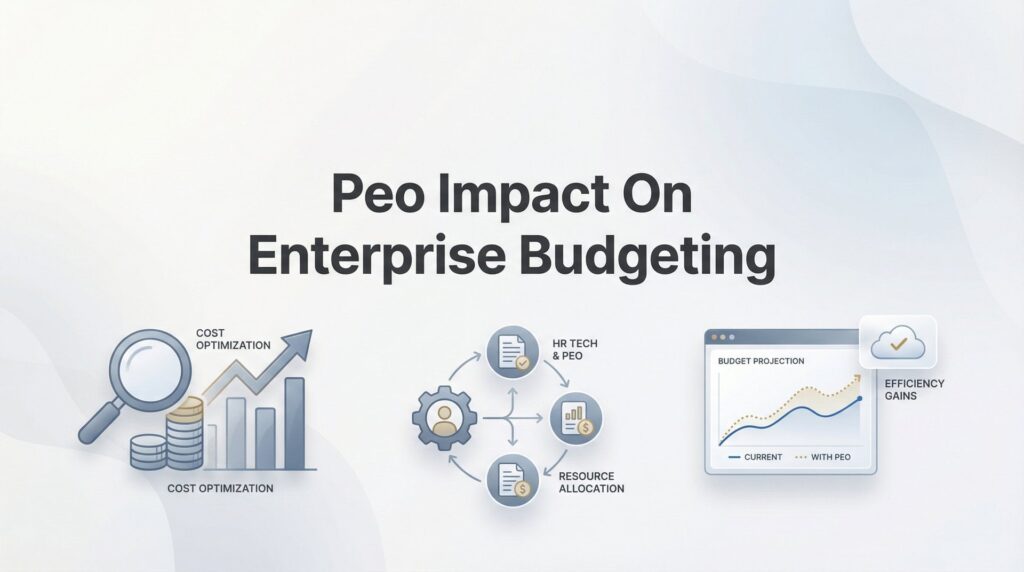
Your CFO just asked you to project next year’s HR costs, and you’re staring at a PEO invoice that bundles payroll, benefits, compliance fees, and administrative charges into three cryptic line items. Good luck explaining that variance to the board.
This is the budgeting reality for enterprises using PEOs. The costs are real, often substantial, and maddeningly difficult to categorize using traditional budget structures. A single PEO invoice might represent what used to be spread across a dozen vendors and internal departments—payroll processing, benefits administration, workers’ comp insurance, compliance software, and HR staff salaries all collapsed into one monthly bill.
The problem isn’t just tracking what you’re spending. It’s forecasting what you’ll spend, allocating those costs accurately across departments, and explaining month-to-month variances when your PEO’s billing doesn’t map cleanly to your general ledger. For enterprise finance teams, this creates real headaches during budget cycles, variance reviews, and contract renewals.
How PEO Invoices Actually Break Down
A typical PEO invoice has four main components, though they’re not always labeled clearly.
Administrative fees are what you pay the PEO for managing everything. This usually shows up as either a flat per-employee-per-month charge or a percentage of gross payroll. PEPM pricing typically ranges from $40 to $150 per employee depending on service level and headcount. Percentage-of-payroll models usually run between 2% and 12%, with higher percentages for smaller organizations and lower rates for enterprises with significant headcount.
The budgeting difference matters. PEPM pricing is easier to forecast if your headcount is stable—multiply employees by the monthly rate and you’re done. Percentage-of-payroll pricing fluctuates with salary changes, bonuses, overtime, and commission payments. A strong sales quarter can unexpectedly inflate your PEO bill by thousands of dollars.
Benefits pass-through represents health insurance premiums, retirement plan contributions, and other employee benefits. The PEO pays the carriers, then bills you for the full amount—often with a markup. This isn’t always transparent. Some PEOs disclose their benefits markup explicitly; others bundle it into administrative fees or negotiate carrier rates that include hidden margins.
From a budgeting perspective, benefits pass-through is your largest and most volatile cost component. Annual renewals can swing 8% to 15% year-over-year, and mid-year enrollment changes create unpredictable spikes. You need to track both the gross cost your PEO charges and what those same benefits would cost if you negotiated directly with carriers.
Payroll taxes are straightforward pass-throughs in theory—the PEO remits federal, state, and local taxes on your behalf and bills you for the exact amount. The complexity comes from multi-state operations. If you have employees in six states, your PEO invoice includes six different sets of state unemployment insurance rates, state income tax withholdings, and local payroll taxes. These rates change annually and vary by your organization’s claims history and state-specific formulas.
Workers’ compensation insurance gets bundled into the PEO’s master policy rather than billed separately. You’ll see a charge based on your payroll and industry classification codes, but it’s no longer a standalone insurance premium you can compare across carriers. Understanding workers’ comp accounting through your PEO is essential for accurate cost tracking. The PEO’s workers’ comp rate reflects their entire client pool’s claims experience, not just yours—which can work in your favor or against you depending on your risk profile.
The budgeting challenge is that these four components arrive as consolidated line items, not itemized breakdowns. Your invoice might show “PEO Services: $847,293” without clearly separating the $120,000 in admin fees from the $650,000 in benefits pass-through and the $77,293 in workers’ comp charges. Allocating that across cost centers requires manual work your PEO may or may not make easy.
What Disappears, What Shifts, What’s New
Moving to a PEO doesn’t just add a new vendor—it fundamentally restructures how HR costs appear in your budget.
Budget categories that typically shrink or disappear: Internal HR headcount often decreases because the PEO absorbs benefits administration, compliance management, and payroll processing work. You might reduce HR staff by one or two FTEs, though enterprise organizations rarely eliminate the function entirely. Benefits broker fees usually go away since the PEO handles carrier negotiations and enrollment. Compliance software subscriptions for things like I-9 management, COBRA administration, and multi-state tax filing become redundant. Standalone payroll processing fees disappear completely.
These reductions create budget savings you can quantify. A benefits broker might cost $15,000 annually. HR software subscriptions might total $25,000. One fewer HR generalist saves $75,000 in salary and benefits. Add those up and you have real offsets against PEO costs. Using a PEO enterprise workforce savings calculator can help you model these trade-offs accurately.
Budget categories that shift rather than disappear: Workers’ compensation is the big one. You’re still paying for it—it’s just no longer a separate insurance policy with a separate invoice. It’s now embedded in your PEO charges, which means it moves from your insurance budget line to your HR services budget line. Same cost, different category.
Health insurance premiums shift similarly. You’re still funding employee health coverage, but instead of paying Aetna or Blue Cross directly, you’re paying your PEO, who then pays the carrier. The economic reality hasn’t changed, but the budget presentation has. This matters for variance analysis—if health costs spike 12%, it shows up as a PEO cost increase, not a benefits cost increase.
New budget line items you need to create: PEO administrative fees deserve their own category. Don’t bury them in general HR expenses—track them separately so you can evaluate ROI and compare providers during renewals. Pass-through reconciliation reserves are also smart. Because benefits and workers’ comp costs can adjust mid-year, building a reserve buffer (typically 5-10% of estimated annual PEO costs) prevents budget overruns when your PEO invoices you for a benefits renewal increase you didn’t anticipate.
Some enterprises also create a PEO cost allocation clearing account—a temporary holding category where all PEO charges land before getting distributed to individual departments. This simplifies monthly close processes and makes variance tracking cleaner.
Why Forecasting PEO Costs Is Harder Than It Should Be
Traditional HR budgeting is relatively predictable. You know your headcount plan, you have historical benefits renewal trends, and payroll is just salary projections times tax rates. PEO budgeting introduces variables that make forecasting messier.
Benefits renewals are the biggest wild card. Your PEO negotiates rates with carriers based on their entire client pool, not just your organization. That means your renewal increase might be 6% even if your claims experience was excellent—or 14% if the PEO’s overall book of business had a bad year. You have less control and less visibility than you would negotiating directly with carriers.
Worse, you often don’t get renewal rates until 60-90 days before the plan year starts. If you’re building your annual budget in October for a January start, you’re forecasting benefits costs without knowing actual renewal figures. Most finance teams use a conservative 10-12% increase assumption, but that’s just educated guessing.
Headcount changes create immediate cost impacts. Add five employees mid-quarter and your PEO invoice jumps that same month. In a traditional setup, you’d see gradual increases—recruiter fees, then onboarding costs, then benefits enrollment. With a PEO, it’s all bundled and immediate. Rapid growth phases make monthly PEO costs swing unpredictably. Understanding the PEO impact on cash flow forecasting helps finance teams prepare for these fluctuations.
Seasonal workforce fluctuations amplify this. If you ramp up temporary staff for Q4, your PEO charges spike for those months, then drop in January. That creates variance noise that’s hard to explain in monthly budget reviews unless you’ve explicitly modeled seasonal patterns into your forecast.
Multi-state operations add tax and compliance cost variability. Every state has different unemployment insurance rates, different workers’ comp classification systems, and different compliance requirements. If you expand into a new state mid-year, your PEO costs increase not just from added headcount but from new state-specific charges you may not have budgeted for.
State unemployment insurance rates can change annually based on your claims experience in that state. If you had layoffs in California last year, your California SUI rate might jump significantly this year—and that flows through your PEO invoice as a higher per-employee cost for California-based staff.
The practical solution is building contingency buffers. Most enterprise finance teams budget PEO costs at 8-12% above the baseline projection to absorb mid-year adjustments. That feels inefficient, but it’s better than explaining budget overruns every quarter.
Distributing PEO Costs Across Your Organization
Your PEO invoice arrives as one consolidated charge. Your budget requires allocating those costs to individual departments and cost centers. The methodology you choose affects how each business unit’s P&L looks and how managers perceive their HR costs.
Headcount-based allocation is the simplest approach. If Marketing has 15% of your total employees, Marketing gets charged 15% of the PEO invoice. This works reasonably well for administrative fees, which are often truly per-employee costs. It breaks down for benefits and payroll taxes, which correlate more closely to salary levels than headcount.
A department with ten junior employees might have the same headcount as a department with ten senior executives, but the executives’ department generates far higher payroll taxes and likely higher benefits costs (if your benefits are salary-tiered). Headcount-based allocation under-charges the high-salary department and over-charges the low-salary department. Accurate PEO headcount reporting is essential for making this method work.
Payroll-weighted allocation distributes PEO costs based on each department’s share of total gross payroll. If Engineering represents 40% of your total payroll, Engineering gets allocated 40% of PEO costs. This more accurately reflects the economic reality—payroll taxes, workers’ comp, and often benefits scale with compensation levels.
The challenge is that payroll fluctuates monthly due to bonuses, commissions, and overtime. If Sales has a huge commission month, they’ll get allocated a disproportionate share of that month’s PEO costs even though their benefits and admin fees didn’t actually increase. This creates variance noise in departmental reporting.
Hybrid approaches split the difference. Allocate administrative fees by headcount (since those are truly per-employee), but allocate benefits, payroll taxes, and workers’ comp by payroll. This requires your PEO to provide invoicing that separately itemizes these components—which not all PEOs do willingly.
Many enterprises discover their PEO only provides a single consolidated invoice with minimal detail. Getting the breakdown you need for accurate allocation requires explicitly requesting itemized billing during contract negotiations. Some PEOs charge extra for detailed reporting. Others provide it as standard but only if you ask.
The practical test: Can you take your PEO invoice and clearly separate admin fees, benefits pass-through, payroll taxes, and workers’ comp? If not, your allocation methodology is built on assumptions rather than actual cost drivers.
Running Variance Analysis When Your Costs Are Bundled
Monthly budget reviews become more complex with PEO billing. A $40,000 variance in your PEO invoice could stem from a dozen different causes, and your PEO’s invoice probably doesn’t break down which factors drove the change.
Controllable variances are things your organization directly influences: headcount changes, salary increases, overtime hours, bonus payments. If you hired eight people in March and your April PEO invoice jumped $12,000, that’s controllable variance—you made a hiring decision that drove the cost increase.
Isolating controllable variances requires tracking your own headcount and payroll data alongside PEO invoices. Build a simple model that projects what your PEO cost should be based on actual headcount and payroll, then compare that projection to the actual invoice. The difference is your uncontrollable variance.
Uncontrollable variances include benefits renewals, workers’ comp rate changes, state unemployment insurance rate adjustments, and PEO fee increases. These happen regardless of your operational decisions. They still need explaining in budget reviews, but they’re driven by external factors or PEO contract terms.
The problem is that most PEO invoices don’t clearly flag when a rate changed. You might see a 7% increase month-over-month without knowing whether it came from headcount growth, a benefits renewal, or your PEO quietly raising administrative fees. Understanding how PEOs change your labor cost reporting helps you ask the right questions. You need to ask your PEO for variance explanations, and not all providers are responsive.
Quarterly reconciliation matters more than monthly tracking. PEO costs have enough natural volatility that monthly variances can be misleading. A quarterly view smooths out timing differences—like when a benefits adjustment gets billed retroactively or when seasonal headcount fluctuations normalize.
Use quarterly variance patterns to inform contract decisions. If your PEO’s administrative fees have increased 15% over two years while your headcount grew only 8%, that’s a pricing problem worth addressing during renewal negotiations. If your benefits pass-through consistently runs 8-10% higher than what you’d pay negotiating directly with carriers, that’s a margin issue you can challenge.
The variance data becomes leverage. Most PEOs expect enterprises to auto-renew without scrutinizing cost trends. Showing up with detailed variance analysis and competitive quotes changes the negotiation dynamic.
When PEO Budgeting Breaks Down
Certain business scenarios expose the limitations of PEO cost structures and make budgeting significantly harder.
Rapid growth creates forecasting chaos. If you’re adding 20-30 employees per quarter, your PEO costs are constantly climbing, but not always proportionally. Benefits costs might lag because new hires don’t enroll immediately. Workers’ comp costs might spike because your industry classification codes change as your employee mix shifts. Administrative fees might decrease on a per-employee basis if you cross volume discount thresholds.
The challenge is that your budget model assumes relatively stable per-employee costs, but rapid growth changes the underlying economics. Organizations managing PEO relationships at 1000+ employees face particularly complex scaling dynamics. You need to ask your PEO how pricing tiers work and at what headcount levels rates adjust. Otherwise you’re forecasting blind.
Acquisitions are particularly messy. You’re integrating employees from another organization, potentially with different benefits elections, different salary structures, and different state footprints. Your PEO needs to absorb these employees mid-year, which triggers immediate cost increases that weren’t in your original budget.
Worse, the acquired employees might have been on different benefits plans with different renewal dates. Harmonizing everyone onto your PEO’s plans can create one-time costs and ongoing cost structure changes that are hard to project without detailed employee data from the acquired company.
Seasonal workforce fluctuations create monthly variance noise. If you hire 50 temporary workers for Q4, your October-December PEO costs spike, then crash in January. That’s expected, but it complicates variance explanations and makes year-over-year comparisons difficult unless you’re explicitly modeling seasonal patterns. Staffing agencies using PEOs deal with this challenge constantly.
Some PEOs handle seasonal workers poorly from a billing perspective—charging full administrative fees for employees who only work two months, or applying benefits eligibility rules that create unexpected costs. You need to clarify how your PEO bills for temporary and seasonal staff before budget season.
Questions to ask your PEO about budgeting support: Can you provide monthly invoices itemized by cost component (admin fees, benefits, payroll taxes, workers’ comp)? How much advance notice will we get for benefits renewals and rate changes? Can you provide reporting that supports our internal cost allocation methodology? What triggers mid-year fee adjustments, and how much notice do we get? Can we get historical cost data broken down by employee, department, or location?
If your PEO can’t or won’t answer these questions clearly, you’re budgeting with incomplete information. That’s a significant operational risk, especially for enterprises where budget accuracy affects board reporting and investor expectations.
Signs your PEO isn’t giving you what you need: Invoices arrive with minimal detail and no cost breakdowns. Variance explanations require multiple follow-up emails and still don’t clarify what changed. Benefits renewal information comes too late to incorporate into your budget cycle. Reporting tools don’t allow you to export data in formats compatible with your financial systems. Customer support can’t answer basic questions about how specific charges are calculated.
These aren’t minor inconveniences. They’re structural barriers to accurate budgeting. If you’re fighting your PEO for basic cost transparency, that’s a provider problem worth addressing.
Making PEO Budgeting Actually Work
The path to better budgeting accuracy starts with understanding exactly what you’re paying for and demanding the reporting transparency to track it properly.
Audit your current PEO invoice structure against your budget categories. Identify where costs are getting lumped together in ways that obscure what’s actually driving changes. Request itemized billing that separates administrative fees, benefits pass-through, payroll taxes, and workers’ comp. If your PEO resists, that tells you something about their willingness to operate transparently.
Build flexibility into your forecasts. PEO costs have more variability than traditional HR cost structures. A 10% contingency buffer isn’t excessive—it’s realistic given benefits renewals, headcount fluctuations, and mid-year rate adjustments. Budget for the variability rather than pretending it doesn’t exist.
Establish clear allocation methodologies before the budget cycle begins. Decide whether you’re allocating by headcount, payroll, or a hybrid approach, then document it and apply it consistently. Changing allocation methods mid-year creates variance noise that’s hard to explain and undermines confidence in your numbers.
Use variance analysis to drive better contract terms. If your PEO’s costs are increasing faster than your headcount or payroll, that’s negotiating leverage. If their reporting doesn’t support your budgeting needs, that’s a service gap you can address during renewals. Most enterprises don’t scrutinize PEO contracts closely enough—they auto-renew and accept incremental cost increases without questioning whether they’re getting value.
Comparing PEO providers on reporting transparency matters as much as comparing headline pricing. A PEO that charges 5% less but provides terrible cost visibility might cost you more in budget overruns, variance explanations, and finance team time than a slightly more expensive provider with excellent reporting and proactive communication about rate changes.
Before you sign that PEO renewal, make sure you’re not leaving money on the table. Many businesses unknowingly overpay because of bundled fees, hidden administrative markups, and contracts designed to limit flexibility. We give you a clear, side-by-side breakdown of pricing, services, and contract terms—so you can see exactly what you’re paying for and choose the option that truly fits your business. Don’t auto-renew. Make an informed, confident decision.