Breakdowns of PEO pricing models, fee structures, hidden costs, and long-term financial impact. Includes comparisons between percentage-of-payroll and per-employee pricing models.
PEO aggregate stop loss explained: this coverage caps your total claims liability during high-cost years, but most employers sign off on it without understanding how attachment points are set or what gaps exist. This breakdown covers how aggregate stop loss works within PEO health plans, how it differs from specific stop loss, and what to scrutinize during renewals to protect your bottom line.
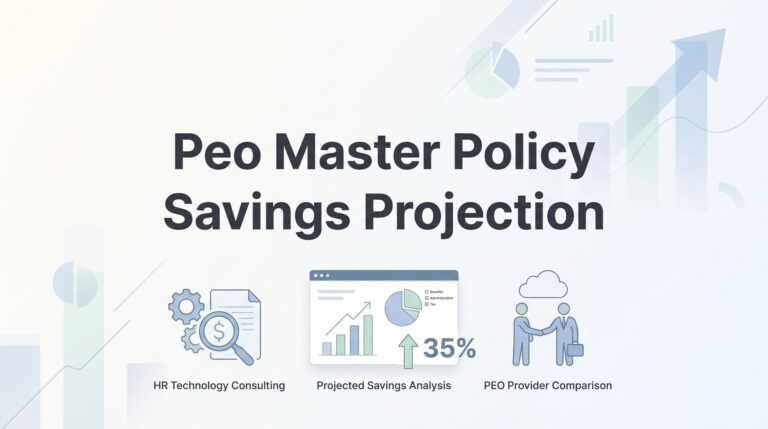
Accurately projecting PEO master policy savings requires more than taking a vendor’s word for it — it demands a side-by-side comparison of your current rates, claims history, and workforce profile against the PEO’s actual master policy structure. This guide walks business owners through the specific calculations needed to determine whether pooled coverage will genuinely reduce costs or simply shift how those costs are structured.
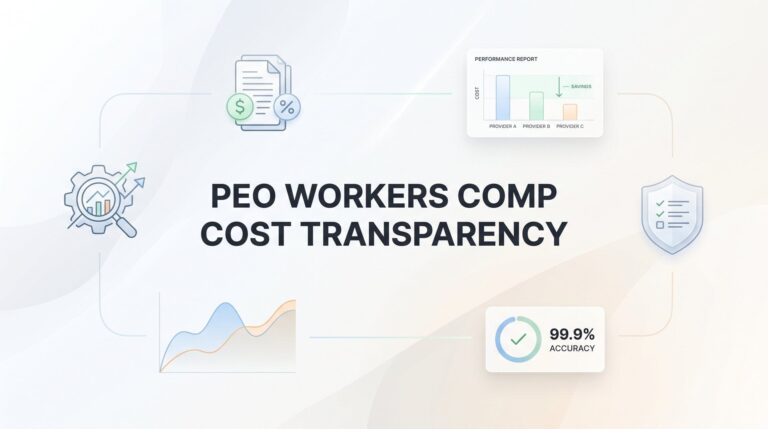
Most business owners paying for PEO services can’t identify their actual workers comp costs because PEOs intentionally bundle this expense within broader fees. This guide on PEO workers comp cost transparency explains how the pricing model works, what specific data points you should demand from your provider, and how to benchmark whether you’re overpaying for coverage—especially critical for businesses in high-risk industries like construction, manufacturing, and staffing.
Before signing a PEO contract, use a structured peo hr automation savings calculator approach to quantify exactly where time and money are being lost to manual HR tasks. This guide walks business owners through auditing current HR labor costs, identifying automation opportunities, and comparing projected savings against actual PEO pricing to build a defensible, data-backed business case.
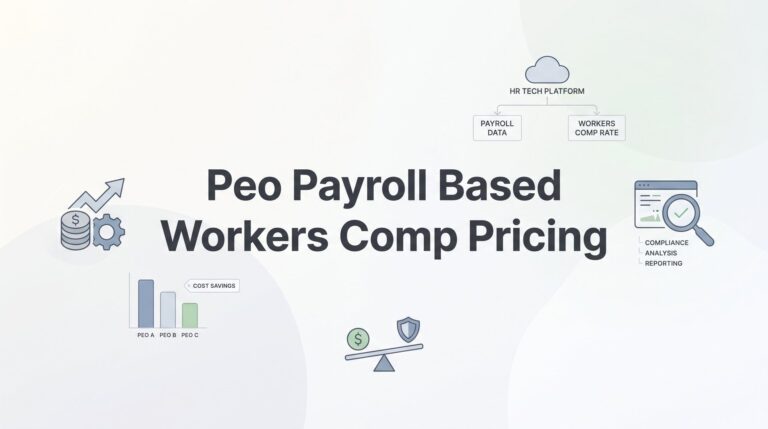
PEO payroll-based workers comp pricing ties your monthly premium directly to your actual payroll, fluctuating each billing cycle based on employee wages and assigned class codes. While marketed as flexible and convenient, this model often lacks transparency—making it difficult for business owners to verify whether they’re paying competitive rates or absorbing hidden fees and subsidizing other companies’ claims within the PEO’s risk pool.
PEO workers comp dividend programs promise refunds based on low claims, but most business owners don’t realize these dividends are typically pooled across hundreds of companies—not tied to your individual safety record. While these programs can provide value, the 12% average returns sales reps tout depend on factors outside your control, and understanding the actual mechanics behind when and why you receive a dividend is crucial before signing up.
Most PEO ROI calculators only show current savings, but growth fundamentally changes the economics. This framework teaches you how to build growth-scenario ROI projections that model real cost trajectories as you scale from 15 to 200+ employees, identify inflection points where PEO value shifts, and stress-test assumptions across different hiring scenarios—so you can make data-driven decisions about PEO partnerships that account for how your business will actually evolve.
A PEO and broker revenue alignment review helps business owners understand the hidden commission structures between their PEO provider and broker to identify potential conflicts of interest and cost inefficiencies. This structured audit process reveals who’s getting paid what from your HR outsourcing arrangement, enabling you to negotiate better terms, eliminate misaligned incentives, and ensure you’re receiving value proportional to what you’re actually spending.
Electrical contractors typically face higher PEO costs than most industries due to elevated workers’ compensation risks from electrocution, falls, and arc flash hazards, combined with multi-state licensing complexity and prevailing wage requirements. Understanding the Electrical Contractors PEO Pricing & Cost Structure before signing helps avoid unexpected rate increases from workers’ comp adjustments, payroll fluctuations, and claims experience that often surface months into the contract whe…
Painting contractors face unique PEO pricing challenges due to elevated workers’ comp risk classifications, seasonal workforce fluctuations, and specialized safety requirements like lead paint protocols and height work. Understanding the specific cost drivers in Painting Contractors PEO Pricing & Cost Structure—from classification codes to seasonal headcount changes—helps you evaluate whether quotes reflect your actual operational risks or if providers are overcharging due to industry inexper…
