
Most businesses evaluate PEO pricing by comparing admin fees and per-employee-per-month costs. That’s a reasonable starting point, but it’s also where most budgeting exercises stop — and where expensive surprises begin.
The costs that actually blow up a PEO budget aren’t usually the ones on the quote sheet. They’re the workers’ comp rate adjustments after a rough claims year, the health renewal that comes in 18% higher than expected, the compliance penalty nobody saw coming, or the mid-contract fee escalation buried in the renewal terms. None of those show up in the initial pricing conversation.
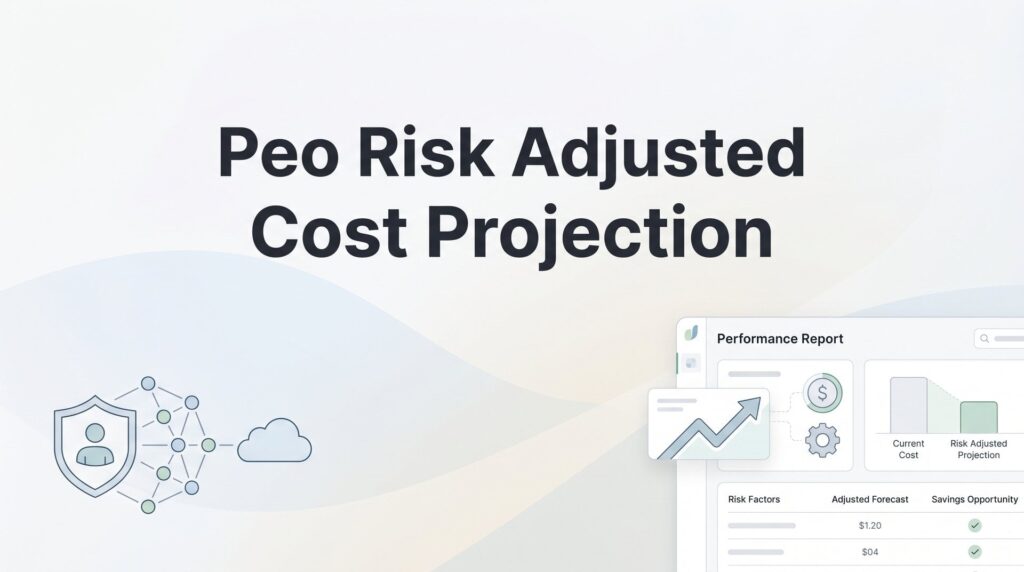
A risk-adjusted cost projection changes that. Instead of modeling what your PEO will cost if everything goes according to plan, you model what it’s likely to cost across a realistic range of outcomes — including the ones you’d rather not think about.
This guide walks you through building that projection from scratch. You don’t need a finance background or specialized software. What you need is a clear framework, your actual cost data, and a willingness to look honestly at where your exposure lives. The output is a 3-year cost picture you can actually make decisions with — and a tool you can use to compare providers on realistic total cost rather than best-case quotes.
If you’re evaluating new PEO providers, renegotiating an existing contract, or just trying to understand whether your current arrangement is still the right fit, this is the exercise worth doing before you sign anything.
Step 1: Establish Your Baseline Cost Structure
Before you can model risk, you need a clean picture of what you’re currently paying — or what you’re being quoted. This sounds obvious, but most businesses don’t actually have this documented at the component level. They have a total invoice number and a vague sense of what’s included.
Start by pulling every cost element out of your PEO arrangement and listing them individually. The typical categories include:
Admin fees: Usually a flat per-employee-per-month charge or a percentage of payroll. These tend to be the most stable component.
Workers’ compensation premiums: Often the most volatile line item. In a bundled PEO arrangement, you may not see this broken out clearly — which is exactly the problem.
Health and benefits contributions: Your employer contribution to medical, dental, and vision. Separate the fixed portion (what you’ve committed to contributing) from the variable portion (what the carrier charges, which resets at renewal).
Payroll taxes: FICA, FUTA, SUTA. These are largely fixed by law, but state unemployment rates can shift based on your claims history.
Ancillary charges: EPLI coverage, HR platform fees, compliance tools, onboarding costs, or anything else bundled into your agreement.
Once you have the full list, do two things. First, separate fixed costs from variable costs. Fixed costs — flat admin fees, per-employee charges — are predictable. Variable costs — workers’ comp, health premiums, SUTA rates — are where your real risk lives. Second, identify which costs are pass-through versus marked-up. Understanding your cost allocation methodology is essential for separating these components accurately.
Pass-through costs are billed to you at the actual carrier or agency rate. Marked-up costs include a margin for the PEO. The distinction matters enormously for projections because marked-up costs can change independently of the underlying rate — the PEO can adjust its margin at renewal even if the carrier rate holds steady.
If you’re already with a PEO, pull 12 to 24 months of actual invoices rather than relying on your contract summary. You’ll often find charges that don’t match your original quote, and those discrepancies are important data points. If you’re evaluating new providers, ask for detailed cost breakdowns by category — not just a total PEPM number. Any provider that resists this level of transparency is worth noting. For a deeper dive into what those line items actually mean, review a thorough breakdown of PEO pricing and cost structure.
Your baseline is the foundation for everything that follows. Sloppy baseline data produces misleading projections, so take the time to get this right before moving on.
Step 2: Identify Your Key Risk Variables
Not every cost category carries the same risk. The goal of this step is to identify which variables are most likely to move, how much they could move, and whether you have any control over them.
For most businesses, the highest-impact variables fall into a handful of categories:
Workers’ comp experience modification rate (EMR): Your EMR is calculated based on your claims history relative to industry expectations. A single serious injury can push your mod rate above 1.0, which directly increases your workers’ comp premium. In a PEO arrangement, this dynamic plays out differently depending on whether you’re in a master policy or a dedicated policy — but the exposure is real either way. Understanding how workers’ comp cost allocation models work will help you see where your claims experience hits your bottom line.
Health plan renewal increases: Health insurance costs have been increasing for most employers over time, though the pace varies by region, carrier, and plan design. The key variable here is your group’s specific claims experience. A high-utilization year can trigger a renewal increase that far exceeds the market average. If your workforce skews older or has had notable claims activity, this is a high-priority variable.
Headcount fluctuation: Many PEO costs are per-employee. If you’re growing, your total cost grows proportionally — and sometimes faster if growth triggers threshold changes in your workers’ comp classification or benefits structure. Model headcount conservatively.
State-specific regulatory costs: If you operate in multiple states or are considering expansion, state-level compliance costs can shift significantly. State unemployment tax rates, state-mandated benefits, and workers’ comp rate filings vary considerably and can change with little notice. Running a state employment law risk review before signing can help you quantify this exposure.
Compliance exposure: This one is harder to quantify but worth including. If your PEO’s compliance support is thin and you’re operating in a high-risk area — multi-state payroll, complex leave administration, wage and hour exposure — the cost of a missed obligation can dwarf your annual admin fees.
Once you’ve listed your variables, rank them by two dimensions: volatility (how much could this realistically change?) and financial impact (how much does a change actually cost you?). A variable that’s highly volatile but affects only a small dollar amount is less important than one that’s moderately volatile but tied to a large cost bucket.
Also note which variables you can influence. Safety programs and return-to-work protocols affect your EMR. Benefits plan design choices affect renewal exposure. Headcount planning is largely internal. Externally driven variables — carrier market conditions, state rate filings, regulatory changes — require contingency modeling rather than mitigation strategies.
Step 3: Build Three Cost Scenarios
This is the core of the projection. You’re going to model three versions of your future costs: a base case, a probable case, and an adverse case. Each one uses the same cost structure but applies different assumptions to your key risk variables.
Keep the mechanics simple. A spreadsheet with your cost categories as rows and your time periods as columns works fine. You don’t need Monte Carlo simulations or actuarial software. Three well-reasoned scenarios built on real data are more useful than a thousand randomly generated ones. If you need a starting framework, a cost structure modeling template can help you organize the inputs.
Base scenario: This uses your quoted or current pricing with only the adjustments your PEO has explicitly disclosed. If your contract includes a stated annual admin fee escalator, apply it. If your benefits renewal cap is documented, use it. The base scenario isn’t “best case” — it’s “everything goes as contracted.” This is what most businesses model when they evaluate a PEO. It’s useful as a reference point, but it’s not your planning number.
Probable scenario: This is your realistic planning number. Apply adjustments based on your company’s actual history and your industry’s general trends. If your claims experience has been average, use a moderate EMR adjustment. If your workforce demographics suggest above-average health utilization, apply a higher renewal assumption than the base case. Factor in any headcount growth you’re actually planning for. The probable scenario should feel uncomfortable but honest — not catastrophic, but not optimistic either.
Adverse scenario: Model what happens if two or three risk variables move against you at the same time. A bad claims year that pushes your EMR up, a health renewal that comes in significantly higher than expected, and headcount growth that lands you in a new workers’ comp classification tier. These events aren’t individually unlikely — and they have a way of clustering. The adverse scenario isn’t meant to be a prediction. It’s meant to show you your downside exposure so you can decide whether you’re comfortable carrying it.
A few practical notes on building these scenarios:
Be specific about your assumptions. Don’t just say “health costs go up.” Say “health costs increase by X% in year two and Y% in year three, based on our last two renewal cycles.” Document the reasoning behind every adjustment. This matters when you use the projection in provider negotiations.
Keep scenarios internally consistent. If you’re modeling headcount growth in the probable scenario, make sure your workers’ comp and benefits costs reflect that growth too. Inconsistent assumptions produce misleading totals.
Don’t average the scenarios. Each one tells you something different. The base case is your contractual commitment. The probable case is your budget number. The adverse case is your risk ceiling. All three are useful; none of them should be blended away.
Step 4: Apply Time Horizons and Compounding Effects
A single-year snapshot misses one of the most important dynamics in PEO cost modeling: compounding. Costs that seem manageable in year one can look very different by year three, especially when you account for how different components reset and escalate over time.
Project each of your three scenarios across 12, 24, and 36 months. Most PEO contracts lock in admin fees for the contract term but allow insurance components — workers’ comp and health benefits — to reset annually. That reset is where compounding starts to matter.
Consider health renewals. A meaningful increase in year one becomes the new base from which year two’s increase is calculated. By year three, the cumulative effect can be substantially larger than any single year’s increase would suggest. Most businesses budget for the next renewal without thinking about what that renewal rate does to the year-after projection. A detailed guide on how to forecast your PEO costs can help you build compounding into your model correctly.
Workers’ comp has a similar dynamic, but the mechanism is different. Your experience modification rate is calculated on a rolling three-year claims window. A bad year doesn’t just affect your premium for that year — it affects your mod calculation for the following two years as well. If your adverse scenario includes a significant claims event, the cost impact should carry forward across your projection period, not reset to baseline the following year. Running a workers’ comp renewal risk analysis before your contract renews can quantify this exposure precisely.
Pay attention to contract renewal timing. Many PEOs adjust pricing at contract renewal, and your negotiating position at that point depends heavily on your claims history during the prior term. If you’ve had a clean run, you have leverage. If you’ve had a rough year, you’re negotiating from weakness. Your projection should note when renewal windows open and what your likely leverage position will be under each scenario.
Also flag any terms in your current or proposed contract that create cost cliffs. Common examples include guaranteed rate periods that expire mid-contract, retroactive premium adjustments based on final claims experience, and minimum premium requirements that kick in at certain headcount thresholds. These aren’t always prominent in contract summaries, but they can create significant cost discontinuities that a straight-line projection won’t capture.
Step 5: Stress-Test Against a Non-PEO Alternative
Your risk-adjusted PEO projection is only useful if you have something to compare it against. The natural comparison is what it would cost to manage the same functions independently — direct carrier relationships, internal HR capacity, standalone workers’ comp coverage, and compliance tools.
Run the same three-scenario framework for your in-house alternative. The categories look different, but the structure is the same:
Direct workers’ comp: Get an actual quote from a standalone carrier. Note the rate, the deposit requirement, and the audit adjustment terms. Your standalone rate will likely be higher than what you access through a PEO master policy — the PEO’s aggregated risk pool is a real cost advantage for many employers, particularly those in higher-risk classifications.
Internal HR staffing: Be honest about what it actually costs to handle payroll administration, benefits management, compliance monitoring, and HR support in-house. This includes salary and benefits for the staff doing the work, not just a rough hourly estimate. For a structured approach to this comparison, explore cost modeling strategies to compare PEO vs internal HR accurately.
Compliance exposure: This is the hardest line item to quantify, but it’s often the most significant. If your PEO is providing meaningful compliance support — multi-state payroll, leave law administration, wage and hour guidance — the cost of replicating that independently through legal counsel, compliance software, and HR expertise can be substantial. Model the cost of getting it right, not just the cost of trying.
The comparison you’re looking for isn’t just which option is cheaper on paper. It’s where the breakeven point sits across your scenario range. At what point in your adverse scenario does the PEO stop being cost-effective relative to the in-house alternative? That threshold is your decision point. A thorough PEO ROI and cost-benefit analysis can help you frame this breakeven calculation with the right inputs.
Be honest about internal capacity. If your HR team doesn’t have deep experience managing workers’ comp claims, navigating state-specific leave requirements, or handling benefits administration at scale, the “cheaper” in-house path may carry hidden costs that don’t show up in your model — but will show up eventually.
Step 6: Use the Projection to Negotiate and Compare Providers
A risk-adjusted projection isn’t just an internal planning tool. It’s also one of the most effective things you can bring into a PEO negotiation or a competitive evaluation.
When you present your scenarios to a PEO provider and ask them to respond to your assumptions, their reaction tells you a lot. Providers who engage seriously — who push back on specific assumptions, explain how their contract terms address your adverse scenarios, and offer written commitments on rate guarantee periods — are demonstrating the kind of transparency that actually matters in a long-term relationship. Providers who deflect, minimize your concerns, or pivot back to their standard pitch are showing you something too.
Use your projection to compare providers on projected cost range rather than quoted price. The provider with the lowest base-case quote may have the widest adverse-case exposure if their contract terms offer less protection against renewal spikes or retroactive adjustments. The total cost picture across your probable and adverse scenarios is more meaningful than a headline PEPM number. Be aware of the contract liability risks that can quietly widen your cost exposure over a multi-year term.
When you’re in these conversations, ask specifically about:
Rate guarantee periods: How long are quoted rates locked, and what can change them before that period expires?
Claims corridors: Does the arrangement include any buffer between your claims experience and your premium impact, or does every dollar of claims flow directly to your rate?
Renewal caps: Are there contractual limits on how much health or workers’ comp premiums can increase at renewal?
Mid-term adjustment triggers: What circumstances allow the PEO to adjust pricing before your contract renewal date?
Get the answers in writing and incorporate them into your projection assumptions. Your model is only as good as the terms backing it.
Making This Decision With Your Eyes Open
A risk-adjusted cost projection isn’t about predicting the future perfectly. It’s about making decisions with your eyes open rather than optimistically assuming the best-case quote is your actual cost.
Before you finalize any PEO selection or renewal, run through this checklist:
Baseline documented: Every cost component identified and separated into fixed versus variable, with pass-through versus marked-up costs flagged.
Risk variables ranked: Key variables identified, ranked by volatility and financial impact, and categorized by what you can and can’t control.
Three scenarios modeled: Base, probable, and adverse cases built across a 36-month horizon with compounding effects included.
Non-PEO alternative stress-tested: Same scenario framework applied to the in-house alternative, with an honest breakeven analysis.
Projection used as a negotiation tool: Scenarios presented to providers, contract terms stress-tested against your adverse case, and key assumptions documented in writing.
The businesses that get burned by PEO costs aren’t usually the ones who picked the wrong provider. They’re the ones who never modeled what could change.
Before you sign that PEO renewal, make sure you’re not leaving money on the table. Many businesses unknowingly overpay because of bundled fees, hidden administrative markups, and contracts designed to limit flexibility. You deserve a clear, side-by-side breakdown of pricing, services, and contract terms so you can see exactly what you’re paying for. Don’t auto-renew. Make an informed, confident decision.