
Most business owners don’t think about employment litigation costs until they’re staring at a demand letter. By then, the math is reactive. You’re calculating damage, not managing risk.
If you’re evaluating a PEO or already using one, you need a clearer picture of what employment-related legal exposure actually costs — and how a co-employment arrangement shifts, or doesn’t shift, those numbers. The honest answer is: it depends entirely on which costs you’re measuring, what the PEO contract actually says, and how your workforce risk profile maps to their coverage structure.
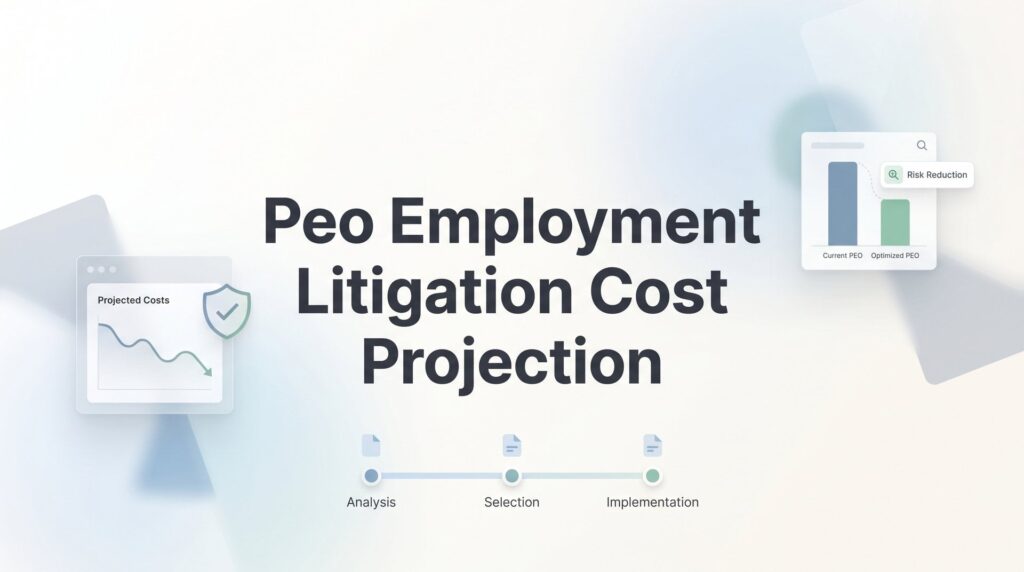
This guide walks you through building a practical litigation cost projection. Not a theoretical model. A working estimate you can use to compare PEO proposals, budget for legal reserves, and understand where your real exposure lives.
We’re talking wrongful termination claims, wage and hour disputes, discrimination allegations, and the operational costs that pile up around them. Some of these a PEO absorbs or mitigates. Others stay squarely on your plate. The difference matters more than most PEO sales decks let on.
Whether you’re a 40-person company trying to decide if a PEO’s EPLI coverage justifies the admin fee, or a 200-person operation auditing whether your current PEO is actually reducing legal spend, this process gives you a framework for projecting real numbers instead of guessing.
Work through these six steps in order. Each one builds on the last, and skipping ahead tends to produce projections that fall apart the moment someone reads the actual contract language.
Step 1: Catalog Your Existing Employment Claim History
You can’t project future litigation costs without understanding your own baseline. Start by pulling every employment-related claim from the last three to five years. That means EEOC charges, state agency complaints, demand letters, settlements, active litigation, and anything that ended with a check written to make a problem go away.
If that documentation is scattered across your legal team, HR files, and your CFO’s inbox, this step will take longer than you’d like. Do it anyway. The gaps in your records are often as revealing as the claims themselves.
Once you have the full list, categorize each claim by type:
Wrongful termination: Claims alleging improper discharge, including retaliation-related terminations.
Wage and hour: Overtime violations, misclassification, meal and rest break issues, off-the-clock work.
Discrimination: Race, gender, age, national origin, religion, pregnancy — any protected class allegation.
Harassment: Sexual harassment and hostile work environment claims.
Retaliation: Claims tied to protected activity like whistleblowing, FMLA requests, or workers’ comp filings.
ADA and accommodation failures: Failure to engage in the interactive process, denied accommodations, disability-related terminations.
For each claim, document total cost — not just the settlement check. Include outside legal fees, internal staff hours spent on document production and depositions, any expert witness costs, and your best estimate of productivity loss in the affected team or department. Most businesses significantly undercount this number because they only look at what showed up on a legal invoice.
Then look for patterns. Are claims clustering around a specific department or manager? Do your wage and hour issues concentrate in one state? Did a particular period of rapid hiring or layoffs generate a spike? Patterns tell you where your structural risk lives, which is exactly what you need for a useful projection. Understanding how to use your PEO to prevent employment litigation starts with knowing where your vulnerabilities are.
If you have zero claim history, that’s data too. But don’t interpret it as zero future risk, especially if you’re growing headcount, entering new states, or going through organizational changes like acquisitions or leadership turnover. Clean history and low risk are not the same thing.
This catalog becomes the foundation for every calculation that follows. The more complete it is, the more reliable your projection will be.
Step 2: Map Which Costs the PEO Actually Takes On
This is where most PEO evaluations go sideways. The sales conversation focuses on what the PEO covers. The contract tells a different story.
Under a co-employment arrangement, the PEO and your company share employer status — but that doesn’t mean you share litigation liability equally. The allocation depends almost entirely on what the client service agreement says, and most CSAs are written to protect the PEO’s exposure, not yours.
The general rule: PEOs typically accept liability for their own administrative errors. Payroll tax filings. Benefits administration. Regulatory compliance related to their specific HR functions. What they almost universally carve out are employer-directed decisions. Hiring choices. Terminations. Performance management. Day-to-day supervision. Promotions. Discipline. These stay with you, because you’re the one making those calls.
Read the indemnification and hold-harmless clauses in the CSA line by line. Look for language that carves out “client-directed” or “worksite employer” decisions. That language is common, and it means the majority of wrongful termination and discrimination claims — the expensive ones — remain your direct financial responsibility even under a PEO arrangement. For a deeper dive into how these clauses work, review how indemnification clauses in PEO agreements affect your cost modeling.
Now look at the EPLI coverage. Many PEOs bundle Employment Practices Liability Insurance into their service package, and this is genuinely valuable. But bundled doesn’t mean comprehensive. Key questions to answer:
Coverage limits: What’s the per-claim and aggregate limit? Is it shared across all the PEO’s clients, or dedicated to your account?
Deductibles: What do you owe before coverage kicks in? A $25,000 deductible on a claim that settles for $40,000 means you’re covering most of it.
Exclusions: Wage and hour claims are frequently excluded from standard EPLI policies. If your biggest historical exposure is overtime violations, the EPLI may not help much.
Retroactive date: Does the policy cover claims arising from events before you joined the PEO? If not, your pre-PEO exposure is still uninsured.
Go back to the claim categories you built in Step 1. For each category, mark whether it would likely fall under PEO indemnification, EPLI coverage, or remain your direct cost. That mapping is the core of your projection. Everything else is arithmetic.
Step 3: Calculate a Per-Employee Litigation Cost Baseline
Now you have a historical claim catalog and a clear map of which costs stay with you. The next step is converting that into a per-employee annual number you can use for projection.
The math is straightforward. Take your total documented litigation costs over the period you cataloged — including all the indirect costs you captured in Step 1 — and divide by your average headcount over that same period. That gives you a rough annual litigation cost per employee based on your own history.
If your own data is thin because you’ve had very few claims, use it as a floor, not a ceiling. Thin claim history in a growing company often reflects luck and small headcount rather than low structural risk. Be honest with yourself about that distinction.
When your own data is limited, you can reference general industry context cautiously. Defense costs alone for a single employment claim routinely run into five figures before any settlement is reached. Wage and hour class actions can escalate significantly faster. The point isn’t to scare you with big numbers — it’s to make sure your per-employee baseline reflects realistic cost levels, not just your check-writing history. Using a structured cost accounting method to compare internal HR vs PEO expenses can help you benchmark these numbers more accurately.
Factor in indirect costs explicitly. When a manager spends two days in a deposition, that’s lost productivity. When HR spends three weeks on document production for a single claim, that’s real cost. When a team’s morale tanks after a harassment investigation, the turnover that follows has a price. These costs don’t show up on legal invoices, but they’re real, and ignoring them makes your projection too optimistic.
Then adjust for your state mix. If you have employees in California, New York, New Jersey, or Illinois, your per-employee baseline needs to be higher for those populations. These states have more employee-friendly statutes, more active plaintiff’s bars, and higher average settlement values across most claim categories. Conducting a state employment law risk review before finalizing your baseline is essential for multi-state employers.
The output of this step is a per-employee annual litigation cost baseline — your comparison number for evaluating PEO proposals.
Step 4: Model How the PEO Changes Frequency and Severity
A PEO doesn’t eliminate employment litigation risk. What a good one does is reduce the frequency of claims reaching litigation and, through EPLI coverage, cap your direct payout on the ones that do. Model these two effects separately, because they work differently.
On frequency: the PEO’s HR compliance infrastructure — handbook development, manager training, termination review processes, regulatory updates — reduces the likelihood that a workplace situation escalates into a formal claim. The degree of reduction depends heavily on your current HR maturity. If you’re running with no HR staff and no documented policies, a PEO’s compliance support will have a meaningful impact. Analyzing your current HR infrastructure costs helps you quantify how much of that gap the PEO actually fills.
Be realistic here. Don’t model a dramatic frequency reduction just because the PEO’s sales materials promise one. Ask the PEO specifically: what does their claims data show for clients at your headcount and industry? If they can’t or won’t share that, build your frequency reduction assumption conservatively.
On severity: EPLI coverage caps your direct out-of-pocket on covered claims, which is genuinely valuable. But work through the math on your specific policy. If the deductible is $25,000 and most of your historical claims settled in that range, the EPLI is protecting you from catastrophic outcomes, not routine ones. That’s still worth something — it just changes what you’re actually buying.
Also check what claim types the EPLI covers. Wage and hour exclusions are common. If a significant portion of your historical claims fall in that category, the severity reduction from EPLI is smaller than it looks on the surface. Reviewing joint employment court cases can help you understand how liability actually plays out in real disputes.
Build two frequency scenarios: one where the PEO’s compliance support produces a meaningful reduction in claim volume, and one where it produces minimal change. Build two severity scenarios: one where EPLI coverage kicks in on most claims, and one where deductibles and exclusions limit the impact. You’ll use these combinations in the next step.
The goal isn’t to pick the number that makes the PEO look good or bad. It’s to understand the realistic range so your projection holds up under scrutiny.
Step 5: Build a Three-Year Projection With Scenario Ranges
You have a baseline, a cost map, and frequency and severity assumptions. Now you build the actual projection.
Run three scenarios across a three-year horizon:
Conservative scenario: The PEO’s compliance support has minimal impact on claim frequency. EPLI deductibles and exclusions limit severity reduction. You’re essentially paying PEO fees for operational convenience with modest litigation cost improvement.
Moderate scenario: The PEO’s HR infrastructure reduces claim frequency meaningfully, particularly for termination and harassment-related claims. EPLI covers a reasonable portion of claims that do reach litigation. Net litigation cost is lower than your baseline, and the reduction partially offsets PEO fees.
Optimistic scenario: Strong compliance support significantly reduces claim volume. EPLI coverage with reasonable limits and deductibles handles most of what gets filed. Litigation cost reduction is substantial and clearly justifies the PEO arrangement from a risk management standpoint.
For each scenario, project annual litigation costs factoring in your headcount growth plans. If you’re adding 30 employees next year, your exposure grows proportionally. If you’re expanding into California or New York, apply your higher per-employee baseline to those new employees. If you’re planning a restructuring or layoff, model a claims spike in year two — those events reliably generate wrongful termination and WARN Act exposure. A PEO cost forecasting guide can help you structure these multi-year projections systematically.
Include the PEO’s full cost in each scenario. Admin fees. EPLI premiums or the bundled cost equivalent. Per-claim deductibles. You’re comparing net cost, not gross savings. A PEO that reduces litigation costs by a meaningful amount but charges more in fees than the reduction is worth isn’t a good deal — the projection needs to show that clearly.
Then stress-test against a single catastrophic claim: a wage and hour class action, a high-profile discrimination suit, or a harassment case that attracts media attention. These are low-probability but high-cost events. Run through how each scenario holds up. Does the EPLI coverage limit protect you? Does the PEO’s indemnification apply? Or does this scenario expose a gap in your projection assumptions?
The output is a simple comparison table: projected litigation cost without PEO versus projected litigation cost with PEO (including all PEO fees) across three years and three scenarios. That table is what you bring to a CFO conversation or a PEO renewal decision.
Step 6: Verify Your Assumptions Against the Actual Contract Language
This step is where most projections either hold up or fall apart.
Take every assumption you’ve built — EPLI coverage limits, indemnification scope, claim categories covered, deductibles — and go line by line through the actual PEO agreement. Not the summary sheet. Not the sales deck. The contract. Learning how to align your PEO employment agreement with business operations is critical to ensuring your projection reflects reality.
Start with the EPLI coverage. Does the limit match what you modeled? Is it a shared master policy or dedicated to your account? If it’s a master policy shared across the PEO’s client base, a bad year for another client can affect your coverage availability. Check the exclusions carefully. If you modeled wage and hour protection and the policy excludes it, your moderate and optimistic scenarios need to be revised.
Check the termination clause. Many PEO agreements allow the PEO to exit with 30 to 60 days notice. If that happens mid-year, you have a coverage gap. Your projection should account for that possibility, especially if you’re modeling a three-year horizon with a provider you haven’t worked with before.
Pay close attention to whether indemnification survives contract termination. This is one of the most overlooked issues in PEO arrangements. Employment claims can be filed months or even years after the underlying events. If you leave the PEO — or the PEO exits the relationship — and the indemnification obligation doesn’t survive, claims filed after termination may be entirely your responsibility even if the events occurred while you were a PEO client. Ask explicitly about tail coverage. Get the answer in writing.
Ask the PEO for their claims data. What’s their average claim cost across their client base? What’s their typical resolution timeline? What percentage of claims go to litigation versus settling early? If they won’t share any of that, treat it as a signal. A PEO confident in their compliance infrastructure and claims management process should be willing to share general performance data. Running a PEO cost variance analysis after your first year can validate whether your initial assumptions held up.
Revise your projection based on what you find. The gap between what you assumed and what the contract actually says is almost always where businesses get burned. Closing that gap before you sign — or before you renew — is the entire point of this exercise.
Your Next Steps
A litigation cost projection isn’t a crystal ball. It’s a decision-making tool. The goal is to replace gut feelings with a structured estimate that holds up when you’re comparing PEO proposals or justifying your current arrangement to a CFO.
Before you finalize your projection, run through this checklist:
1. You’ve cataloged at least three years of claim history by type and fully-loaded cost.
2. You’ve mapped which costs the PEO absorbs versus which stay with you, based on the actual CSA language.
3. You’ve built a per-employee baseline that includes indirect costs and adjusts for your state mix.
4. You’ve modeled frequency and severity reductions with realistic, defensible assumptions.
5. You’ve run three scenarios across a three-year horizon including all PEO fees.
6. You’ve verified every assumption against the actual contract language, including tail coverage and termination provisions.
If your projection reveals that a PEO’s litigation cost reduction doesn’t meaningfully offset their fees for your specific risk profile, that’s valuable information. It might mean a different PEO structure, a standalone EPLI policy, or investing in internal HR infrastructure instead. The numbers should drive the decision, not the other way around.
Many businesses unknowingly overpay because of bundled fees, hidden administrative markups, and contracts designed to limit flexibility. Before you sign that PEO renewal, make sure you’re not leaving money on the table. Don’t auto-renew. Make an informed, confident decision.