
Most business owners know that a PEO shows up as an operating expense. What they rarely do is model what happens to everything else. The workers’ comp premium that drops when you join a pooled program. The benefits cost that shifts when you access large-group rates. The HR headcount you might reduce—or the compliance legal spend you stop accumulating quietly in the background. Those aren’t vendor talking points. They’re real line items, and they move in different directions when you bring a PEO in.
The problem is that most PEO evaluations happen at the wrong level. Someone compares the PEO fee against current payroll processing costs, decides it’s “roughly comparable,” and either signs or walks away. That’s not a cost model. That’s a surface-level comparison that misses most of the actual financial picture.
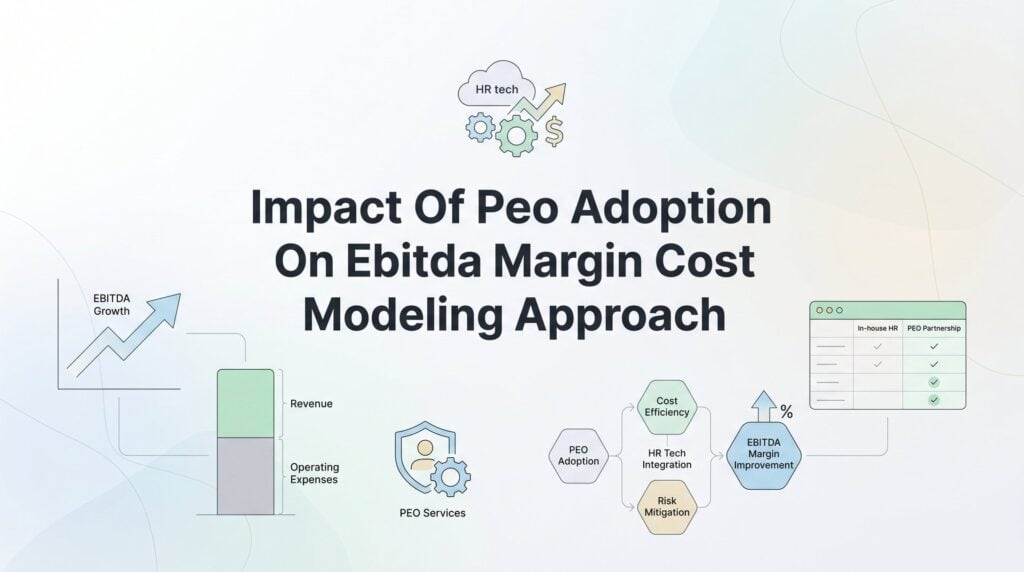
This article walks through a practical cost modeling approach for evaluating PEO adoption at the EBITDA level—the metric that actually matters in board reporting, M&A contexts, and serious operational reviews. The goal isn’t to build a case for or against a PEO. It’s to build a model that tells you the truth either way. If you’re still getting oriented on PEO cost structures and pricing mechanics more broadly, start with a foundational PEO cost guide first. This piece assumes you already understand the basics and want to go deeper on the financial modeling side.
Why EBITDA Is the Right Lens Here
Top-line cost comparisons are tempting because they’re simple. You take what you’re currently spending on benefits, payroll processing, and HR staff, then compare it to what the PEO will charge. If the PEO costs more, you pass. If it costs less, you sign. Clean and fast.
The problem is that this approach treats the PEO fee as the only variable, when in reality a PEO touches multiple operating cost lines simultaneously. Some go down. Some get replaced. One net-new cost gets added. EBITDA captures the aggregate effect of all of those shifts, which is exactly why it’s the right frame for this analysis. For a deeper look at which specific levers matter most, the breakdown of PEO impact on EBITDA margin covers this in detail.
The specific line items a PEO can affect within EBITDA include payroll tax administration costs, employer-side benefits premiums, workers’ compensation premiums, HR staff compensation (fully loaded), compliance and employment law legal spend, and recruiting and turnover costs. Each of these sits above the EBITDA line. Each is a legitimate candidate for cost displacement when a PEO enters the picture.
What a PEO does not affect: depreciation, amortization, interest expense, and income taxes. Those sit below EBITDA and are outside the scope of this model entirely. It’s worth being explicit about this because vendors sometimes blur the line when they’re building ROI calculators. Keep your model scoped to operating costs only, and you’ll keep it honest.
One more framing point worth making: the EBITDA impact of a PEO isn’t just about cost reduction. It’s also about cost predictability. Workers’ comp premiums that fluctuate with your experience mod create P&L volatility. A PEO arrangement that stabilizes those costs has real value in a planning context, even if the dollar amount doesn’t change dramatically. That’s harder to model but worth noting as a qualitative factor alongside the numbers.
Building the Pre-PEO Baseline
Before you can model anything, you need an honest picture of what you’re actually spending today. This sounds obvious, but it’s where most cost models fall apart. People pull benefits invoices and payroll processing fees, call it a baseline, and miss half the picture.
Here’s what the baseline needs to include:
Fully loaded HR headcount cost: This means salary plus payroll taxes, benefits, and any other compensation for every person whose primary function is HR, payroll, or benefits administration. If your office manager spends 30% of their time on HR tasks, include 30% of their fully loaded cost. This is where most baselines are understated. A structured approach to comparing internal HR vs PEO expenses can help you capture these costs accurately.
Current benefits spend per employee: Use the employer-only contribution, not the gross premium. If your company pays $600/month per employee toward health insurance and the employee pays $200, your number is $600. Gross premium overstates your actual cost and will make the PEO comparison look worse than it is.
Workers’ comp premium: Pull the actual annual premium, not the estimated deposit. Also note your current experience modification rate (EMR or mod). If your mod is above 1.0, you’re paying a surcharge on top of base rates, and that’s a meaningful lever in the PEO model.
Payroll processing fees: Include all third-party payroll vendor costs—base fees, per-transaction charges, year-end filing fees, and any add-on modules for time tracking or reporting.
Compliance and employment law spend: This is the hardest one to pull, because it’s often buried in general legal or professional services. Try to isolate costs attributable to HR-related legal matters: handbook reviews, termination guidance, agency charge responses, and similar. If you’ve had zero compliance spend in the past two years, that might be luck rather than a clean record—factor in a reasonable annual estimate.
Annualized turnover cost: This is rarely in the financials as a discrete line item, but it’s real. Recruiting fees, onboarding time, lost productivity during ramp—these add up. If you have turnover data and some sense of average cost-per-hire, include a conservative estimate.
Two common mistakes worth calling out explicitly. First, owners often forget to include their own time spent on HR tasks. If you’re spending four hours a week handling employee issues, benefits questions, and compliance matters, that time has a cost—even if it doesn’t show up on a payroll register. Second, some businesses use budgeted or prior-year-average figures rather than current-year actuals. The model needs to reflect what you’re actually spending right now, not what you planned to spend or what you averaged over three years. Understanding how PEOs change your labor cost reporting can help you identify line items you might otherwise overlook.
Structuring the PEO Side of the Model
Once you have a clean baseline, you can build the PEO cost inputs. This side of the model has two distinct categories that need to stay separated: costs that replace existing spend, and costs that are net-new.
The PEO’s administrative fee is the net-new cost. It’s either structured as a per-employee-per-month (PEPM) charge or as a percentage of gross payroll. The PEPM model is easier to forecast because it scales with headcount, not compensation levels. The percentage-of-payroll model can create unexpected cost increases if you give raises or hire at higher salary bands. Know which structure you’re being quoted and model it accordingly. For a thorough walkthrough of how providers actually build these charges, see this guide on PEO cost allocation methodology.
Benefits premiums under the PEO’s master plan are a cost displacement, not an addition. Your current employer contribution gets replaced by the PEO’s rate for equivalent or comparable coverage. If the PEO’s rate is lower (which it often is for smaller employers accessing large-group pricing), the difference is a cost reduction. If it’s higher or comparable, that savings assumption goes to zero and the model adjusts.
Workers’ comp under PEO pooling works similarly. Your current premium gets replaced by the PEO’s pooled rate for your industry classification. The key variable here is your current experience mod. If your mod is elevated, joining a PEO pool can produce meaningful rate relief. If your mod is already at or near 1.0 and your industry class has favorable base rates, the savings are likely modest.
Some PEOs bundle technology platforms—HRIS, time tracking, benefits enrollment portals—into their administrative fee. Others charge separately. If you’re currently paying for standalone HR software, that cost gets displaced. If you’re not, any technology fee the PEO charges is net-new and needs to show up in the model as an addition. A side-by-side look at PEO vs HR software stack options can help you evaluate whether bundled technology represents real savings or just a repackaged cost.
Here’s the distinction that matters most: cost displacement reduces a line item that already exists. Cost addition creates a new one. The PEO admin fee is always an addition. Everything else—benefits, workers’ comp, payroll processing, HR software—is a displacement. If you model them as additions rather than displacements, you’ll overstate the PEO’s cost and understate its value. That’s a common mistake, and it leads to incorrect decisions in both directions.
A few components make modeling genuinely tricky. Workers’ comp experience mod adjustments take time—your current claims history may follow you into a PEO arrangement for the first year or two, depending on how the PEO structures their pooling. Benefits renewal rates are uncertain; the PEO’s rate today may not be the rate at year two. And many PEOs offer volume-based pricing tiers, so the per-employee cost at 50 employees may be different from the cost at 80. Build your model with the current headcount, then run a sensitivity check at projected headcount in 18 months.
Calculating the Net EBITDA Margin Effect
The actual calculation is straightforward once the inputs are clean. Take the total operating costs you expect to be displaced by the PEO, subtract the total PEO cost (admin fee plus any net-new charges), and you have the net operating cost change. Express that as a percentage of revenue to get the margin impact in basis points.
Net EBITDA margin change = (Pre-PEO costs displaced − Total PEO cost) ÷ Annual revenue
To make the mechanics concrete, here’s a hypothetical example. Imagine a 60-employee company doing $8 million in annual revenue. Current state looks something like this: fully loaded HR staff cost of $180,000 (one HR generalist plus fractional owner time), employer benefits contributions of $420,000 annually, workers’ comp premium of $95,000 with an experience mod of 1.15, payroll processing fees of $18,000, and compliance/legal spend of $22,000. Total relevant operating cost: $735,000, or about 9.2% of revenue.
Under a PEO arrangement, the model might look like this: PEO admin fee of $72,000 annually ($100 PEPM × 60 employees × 12 months), benefits cost under PEO master plan of $390,000 (a modest reduction from current rates), workers’ comp under pooled program of $74,000 (rate improvement plus mod normalization), payroll processing absorbed into admin fee ($0 additional), and compliance legal spend reduced to $8,000 (still budgeting for occasional needs). Total PEO-era operating cost: $544,000, or about 6.8% of revenue. If you want to present these shifts cleanly in your reporting, this guide on PEO costs on financial statements walks through the presentation mechanics.
Net operating cost reduction: $191,000. Margin improvement: approximately 240 basis points. That’s a meaningful shift for a business in this size range.
Now, that example is deliberately illustrative. Your numbers will be different, and in some cases significantly so. The point isn’t the specific outcome—it’s the structure of the calculation. You’re not comparing “PEO fee vs. payroll processing fee.” You’re comparing the full pre-PEO operating cost stack against the full post-PEO operating cost stack, then expressing the difference as a margin effect.
The margin impact tends to be more pronounced for smaller companies. A 40-person business with a standalone HR hire, independent benefits broker, and unoptimized workers’ comp program has relatively high per-employee overhead. A 200-person company with a scaled HR team, negotiated benefits rates, and a clean claims history has less room for improvement. The model will tell you where you sit on that spectrum. Don’t assume you’re in the high-impact category before you run the numbers.
Where the Model Gets Unreliable
Every cost model has assumptions baked in, and some of those assumptions are more fragile than others. Knowing which ones to stress-test is more useful than pretending the model is precise.
The assumption most likely to disappoint: workers’ comp savings. If your claims history is what’s driving your elevated experience mod, that history may follow you into the PEO pool—at least partially—for the first policy period. PEOs handle this differently. Some absorb the risk fully at day one. Others use a blended mod approach that phases in savings over time. If a PEO is projecting large workers’ comp savings in year one without explaining exactly how they’re treating your claims history, push back on that assumption hard. This guide on reducing your experience modification factor through a PEO explains the mechanics in detail.
Benefits savings at renewal are another fragile input. The PEO’s current rates reflect their current pool composition and carrier negotiations. Renewal rates can move, and they don’t always move in your favor. A model that assumes static benefits savings across a three-year horizon is probably too optimistic.
The most common assumption that simply doesn’t happen: HR headcount reduction. Many businesses model a PEO arrangement as an opportunity to eliminate an HR role, then never actually make that change. The person gets redeployed, or the reduction feels too disruptive, or the timing never works out. If your model depends on eliminating a fully loaded $90,000 role to show positive EBITDA impact, that savings needs to be in the “optimistic” scenario only—not the base case.
Run three versions: conservative (no headcount reduction, modest benefits savings, workers’ comp savings phased in over two years), moderate (partial headcount reduction, current PEO benefits rates held for 18 months, workers’ comp savings at 60% of projected), and optimistic (full headcount reduction, benefits savings sustained, workers’ comp improvement at full projected rate). If the conservative scenario still shows positive EBITDA impact, you have a durable case. A PEO cost variance analysis framework can help you track how actual results compare to each scenario over time. If you need the optimistic scenario to break even, that’s important information.
One more thing that almost always gets left out of year-one models: transition friction. Implementation takes time. Parallel processing during the transition creates temporary cost overlap. Employees have questions that pull manager time. HR staff are focused on the switch rather than normal operations. There’s a real EBITDA drag in the first 90 to 180 days that should be modeled as a one-time cost, separate from the steady-state analysis. It doesn’t change the long-term math, but it affects cash flow and the payback period calculation.
When the Numbers Tell You to Walk Away
A good cost model isn’t built to justify a decision you’ve already made. Sometimes it tells you the PEO doesn’t pencil out, and that’s a valid and useful outcome.
The EBITDA case tends to be weakest in a few specific scenarios. Companies that already have competitive benefits rates—either through a strong broker relationship, industry association plans, or scale—often find that the PEO’s master plan offers little improvement and sometimes costs more. Companies with low workers’ comp exposure or clean claims histories don’t have much to gain from pooling. Businesses with lean, efficient HR operations—where the HR function is already running at a low per-employee cost—have less displacement opportunity for the PEO to capture.
There are also industries where PEO pooling simply doesn’t provide rate advantages. If your industry classification carries high base rates and the PEO’s pool has significant exposure in that class, you may not see the rate relief that companies in lower-risk industries experience. Understanding the workers’ comp underwriting risk review process can help you anticipate whether your profile will qualify for favorable pooled rates.
Non-financial factors can still justify PEO adoption even when the EBITDA case is thin. Compliance risk reduction matters, especially for businesses operating across multiple states where employment law complexity is high. Management bandwidth is real—if the owner or leadership team is spending meaningful time on HR issues, there’s a quality-of-life and opportunity cost argument that doesn’t show up in the P&L. Those are legitimate considerations. Just keep them separate from the cost model. Don’t blend qualitative factors into a financial analysis to make the numbers work.
If your model shows a marginal or neutral EBITDA impact, the right move is to compare multiple PEO providers before concluding that PEO adoption doesn’t make sense. Pricing varies more than most buyers realize. Administrative fee structures, benefits plan designs, and workers’ comp arrangements differ meaningfully across providers. What looks like a break-even decision with one PEO might look like a 150 basis point improvement with a different provider offering better rates for your employee profile. A solid PEO cost forecasting guide can help you project how those differences compound over a multi-year horizon.
Build the Model Before You Talk to Anyone
The value of this exercise isn’t proving that a PEO is worth it. It’s building a model that gives you the answer before a vendor gives you theirs.
Every PEO sales team has an ROI calculator. It will show you savings. It will use their assumptions about your current costs, their projected rates, and their best-case scenario for workers’ comp improvement. That calculator is not a neutral tool. Your model, built from your actual financials, is.
Pull your numbers first. Build the baseline from real current-year data. Structure the PEO inputs carefully, distinguishing cost displacement from cost addition. Run three scenarios. Look at what the conservative case actually shows. If it’s positive, you have a durable financial case for moving forward. If it’s neutral or negative, you have clarity—and you can either walk away or use the model to push harder on pricing.
If you’re at the point of comparing providers, the pricing variation across PEOs can materially change your model outcomes. PEO Metrics helps businesses run those comparisons with real pricing data and transparent cost breakdowns—so the numbers in your model reflect actual quotes, not estimates.