
A benefits renewal lands on the CFO's desk. The PEO says the plans are still competitive. HR says recruiting is getting harder. Employees complain about payroll deductions, but nobody can tell whether the company is overpaying, underinvesting, or looking at the wrong comparison.
That's the point where most companies start “benchmarking” and immediately get bad answers. They compare one renewal sheet to another, ask a broker what similar firms are doing, or look at a national average that has nothing to do with their labor market. None of that is rigorous enough to support a renewal decision, a PEO switch, or a negotiation.
Employee benefits benchmarking should answer a narrower and more useful question: how does the current program perform against the right market on cost, contribution strategy, participation, and plan value once the full PEO economics are included? That's the standard that gives HR leaders and finance teams a defensible position.
Table of Contents
- Why Most Benefits Comparisons Miss the Mark
- How to Define Your Peer Group and Key Metrics
- Where to Find and Normalize Benchmark Data
- How to Analyze PEO Benefits vs The Market
- Common Mistakes That Invalidate Your Analysis
- Turning Your Benchmark Findings Into Negotiation Leverage
Why Most Benefits Comparisons Miss the Mark
Most companies don't have a benefits problem. They have a comparison problem.
The usual process looks familiar. A renewal arrives. Someone glances at employee payroll deductions, someone else checks whether the deductible feels high, and the broker or PEO account team says the package is in line with the market. That's not benchmarking. That's anecdotal reassurance.
A serious benchmark starts with the quality of the underlying market data. The 2023 UBA Employee Benefits Benchmarking Trends Report drew on $28 billion in healthcare spending, nearly 1,000,000 employees, and 10,389 employers using 2022 data, which is the kind of scale that makes segmented comparisons by employer size, industry, and geography meaningful. That matters because a benchmark built on a thin or mismatched sample can make an expensive plan look normal.
What superficial comparisons get wrong
The weakest comparisons focus on one visible number. Usually that's the monthly premium. In a PEO setting, that's even riskier because premium pricing is only one part of the buyer's actual cost.
A company can have:
- A lower premium with worse economics if employees face heavy out-of-pocket exposure and participation falls.
- A richer plan that still underperforms if the PEO administration fee erodes the value of the underlying plan access.
- A competitive employer contribution strategy on paper that still loses candidates because the local market expects a different deductible structure or family coverage approach.
Practical rule: If the comparison only answers “What does the medical plan cost?”, it's incomplete. The real question is whether the company is buying the right mix of coverage, contribution, and administration for its workforce.
That's why plan richness alone isn't enough. A rich plan can be mispriced. A leaner plan can be the right answer if the savings are real and the workforce fit is strong. The benchmark has to show both.
What a defensible benchmark should answer
A useful benchmark gives leadership a short list of decisions, not a stack of spreadsheets. It should clarify whether the company is paying above market, contributing below market, or offering a design that's out of sync with the talent market it hires from.
That becomes especially important inside a PEO, where opaque pricing often hides the line between insurance cost and administrative cost. Companies that want a clearer view into those issues usually run into the same challenge addressed in this guide on PEO benefit plan transparency issues.
A good project ends with specific actions such as:
- Renegotiate contributions because the employer is below market on employee-only coverage.
- Redesign a plan because participation is weak and the current design isn't landing with employees.
- Press the PEO on fees or renewal protections because the all-in economics don't justify the package.
That's the standard. Not “competitive enough.” Not “similar to peers.” Defensible, measurable, and usable in a negotiation.
How to Define Your Peer Group and Key Metrics
Most bad benchmark work fails before the first spreadsheet is built. The peer group is wrong, or the metrics are too shallow to explain what's really happening.
A company with a distributed sales team, a young workforce, and strong hiring competition shouldn't benchmark itself against a local manufacturer with long tenure and low enrollment volatility. Even if both firms have the same headcount, they are not buying benefits in the same labor market.
Start with the labor market you actually hire from
Peer group design should be strict enough to remove noise and flexible enough to reflect how the company competes for talent.
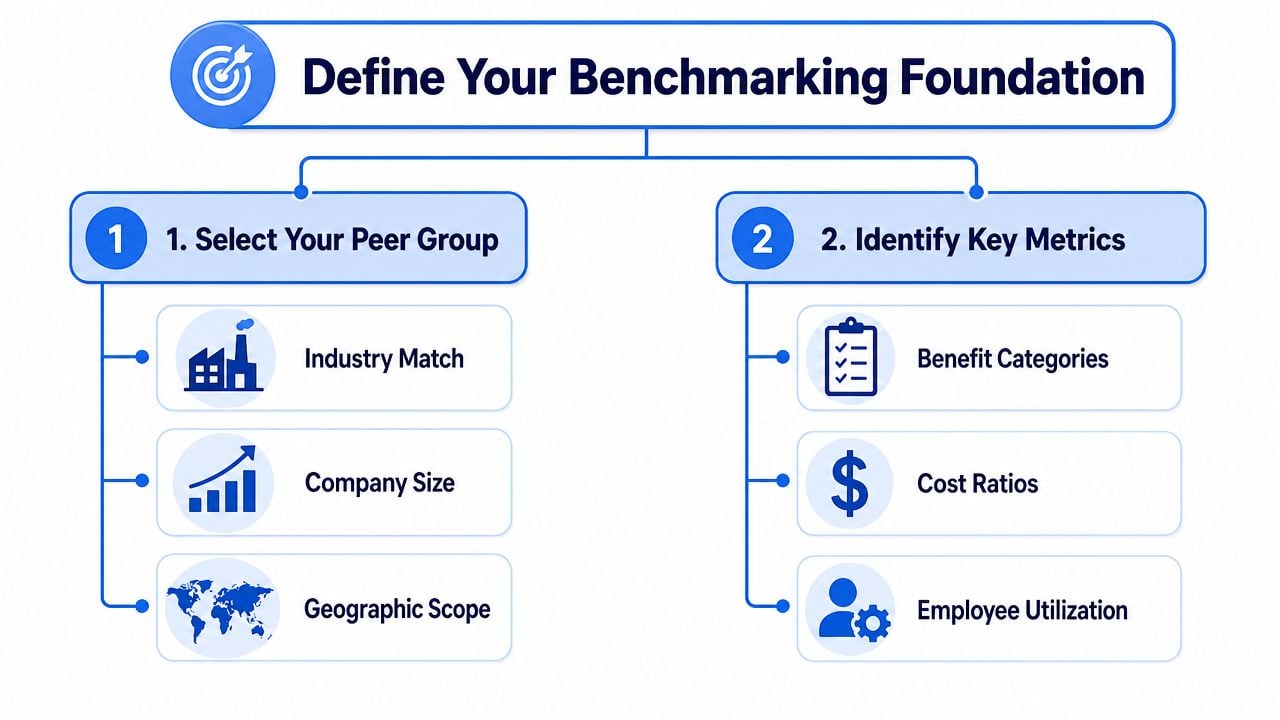
Three filters usually matter most:
- Industry fit: Use a peer set that reflects the company's hiring environment and job mix. A software-enabled services firm may compete more directly with other office-based employers than with every business in its NAICS category.
- Company size: Benefits strategy changes materially across headcount bands. Employer contributions, carrier access, and plan administration all behave differently as the group grows.
- Geography: A national benchmark can be useful for context, but benefit expectations are still local. Multi-state employers often need more than one comparison lens.
For teams with international operations or leadership benchmarking outside the U.S., the decision framework used in designing UK employee benefits plans is useful because it shows how plan structure, workforce expectations, and statutory context can change what “competitive” means.
The right peer group is not the broadest one. It's the one that best reflects the employers competing for the same people.
Track metrics that explain both competitiveness and waste
Once the peer set is defined, the next mistake is measuring only premiums and plan names. Modern benchmark work is more granular. As summarized in this overview of employee benefits benchmarking trends from Mercer and SHRM, benchmarking now focuses on contribution rates, participation rates, utilization rates, and total benefits cost, and Mercer tracked a 23% decrease in organizations offering active Defined Benefit Retirement Plans over a three-year period. That kind of shift matters because it shows how employer strategy changes over time, not just how many companies offer a benefit.
The practical takeaway is simple. A benchmark should include metrics that explain both market position and financial efficiency.
A solid metric set usually includes:
- Employer versus employee contribution split: This reveals affordability. A plan can look competitive until payroll deductions are compared with peers.
- Participation rate by plan and tier: Low enrollment can signal poor value, poor communication, or a workforce mismatch.
- Deductible and out-of-pocket structure: These determine how employees experience the plan.
- Total benefits cost: This brings finance into the same conversation as HR.
- Plan menu logic: Too many plans can create confusion. Too few can push employees into poor-fit options.
A simple blueprint for the project
Before any external data is pulled, build one internal baseline. That baseline should sit in one place and include current plan details, employer contributions, employee payroll deductions, participation, and any PEO-specific administrative charges allocated to benefits.
That's where tools built for side-by-side vendor review can help. A structured PEO financial benchmarking tool makes it easier to line up plan cost, fee structure, and trade-offs instead of reviewing each PEO proposal in isolation.
If the benchmark can't show who pays, who enrolls, and what the company gets in return, it won't support a renewal strategy.
Where to Find and Normalize Benchmark Data
The quality of the answer depends on the quality of the inputs. There are often enough data sources already available. The problem is that they rarely combine them well, and they almost never normalize them before drawing conclusions.

Use multiple data sources on purpose
Benchmark data usually comes from four places, and each has a different role:
- Large market reports: These provide broad direction and useful segmentation when the sample size is credible.
- Broker benchmarking data: Often more specific, but sometimes shaped by the broker's own book of business.
- PEO proposal data: Helpful for understanding what's available inside a master-plan environment, but not neutral on its own.
- Internal company data: Enrollment, deductions, and plan selection patterns often reveal more than any external report.
This multi-input approach matters outside medical, too. For companies reviewing their total risk spend, a guide on how to lower workers comp premiums is a useful parallel because it shows the same discipline at work: compare the right data, understand the rating mechanics, and separate controllable cost drivers from market noise.
Normalize before anyone draws conclusions
Raw comparisons can mislead fast. Two plans can look similar until geography, workforce mix, and coverage tier enrollment are layered in.
Normalization means adjusting the benchmark so it reflects the company's actual context. At minimum, that means checking:
- Geographic market: Hiring in one metro area is not the same as hiring nationally.
- Workforce demographics: A younger, mostly employee-only population will behave differently from an older workforce with heavier family enrollment.
- Coverage mix: If one employer has far more dependents enrolled, premium and contribution comparisons will distort quickly.
- Plan type alignment: A high-deductible health plan should be compared against similar plan structures, not only against richer PPO options.
Normalize the data before debating the answer. Otherwise the meeting turns into an argument about whose numbers are “right” instead of what decision the company should make.
What good normalization looks like in practice
A disciplined team creates one comparison file with adjusted benchmark notes beside every line item. If a peer group is regional, note that. If the workforce skews younger than the benchmark, note that. If the current PEO plan has a materially different dependent contribution structure, note that too.
That process gets easier when the company uses a repeatable framework instead of ad hoc broker summaries. A side-by-side PEO medical plan comparison framework helps force apples-to-apples review across plan design, contribution strategy, and administrative context.
The benchmark doesn't need to be perfect. It needs to be honest about what's comparable and what isn't.
How to Analyze PEO Benefits vs The Market
At this point, the benchmark becomes useful or turns into shelfware. The analysis has to move beyond “our plan versus their plan” and into total economics.
That matters more in a PEO relationship because the buyer isn't purchasing only insurance. The buyer is purchasing a bundle that may include plan access, administration, payroll integration, compliance support, and service. As explained in this discussion of benchmarking the total economics of employee benefits, most guidance stops at plan features when the fundamental decision is the all-in cost after admin fees and plan trade-offs. That's the right frame for a PEO review.
Build one comparison sheet that finance and HR can both use
Start with a side-by-side layout. Keep it tight. If the file is too detailed to use in a leadership meeting, it won't shape a decision.
| Metric | Your Plan | Benchmark (Industry/Geo) | Variance (%) | Notes/Action |
|---|---|---|---|---|
| Medical employer contribution | ||||
| Employee-only payroll deduction | ||||
| Family tier affordability | ||||
| Deductible structure | ||||
| Out-of-pocket exposure | ||||
| Participation rate | ||||
| PEO admin fees tied to benefits | ||||
| Total all-in benefits economics |
The point of the table isn't precision for its own sake. It forces everyone to look at the same unit of analysis. A CFO sees spend. HR sees competitiveness. Leadership sees trade-offs.
Model the PEO decision as total economics
The core PEO question is simple: is the company getting enough value from the combined benefits and administration package to justify the full cost?
That requires comparing two bundles, not two premiums:
- PEO scenario: medical and ancillary plan costs, employer contributions, employee contributions, PEO administrative fees, and any credits or protections tied to renewal.
- Non-PEO or alternative scenario: market plan costs, internal admin burden, broker support model, payroll or HR platform implications, and any added compliance workload.
A company may find that the PEO offers stronger plans but at a fee level that wipes out much of the advantage. Another company may find the opposite. The administrative relief, service infrastructure, and plan access may justify the cost even if a line-item medical comparison looks higher.
That's why a direct benchmark against the open market often fails unless the analysis includes everything. Teams that want to pressure-test this thoroughly usually need a structured review of PEO benefits cost benchmarking so they can separate plan pricing from bundled fees and contract terms.
Use the findings to classify each gap
Every variance should fall into one of three categories:
Paying more for a justified reason
The company may be spending above benchmark, but the higher spend buys a better contribution strategy, stronger retention positioning, or administrative capacity that leadership values.Paying more without enough return
Savings frequently reside in these situations. The employer may be carrying high fees, weak renewal terms, or a contribution structure that doesn't produce recruiting or retention value.Underinvesting in a way that creates downstream cost
A lean contribution model can lower immediate employer spend while increasing recruiting friction, low participation, or employee dissatisfaction.
A benchmark is most useful when it tells leadership which gaps to defend, which gaps to fix, and which gaps to negotiate.
That classification creates a cleaner path to action. It also prevents a common overcorrection, which is cutting cost in the wrong place because one line item looked high.
Common Mistakes That Invalidate Your Analysis
Most flawed benchmark projects don't fail because the team lacked effort. They fail because one bad assumption gets baked into the analysis and nobody catches it until renewal decisions are already moving.
Detail is paramount. A benchmark can look polished and still be unusable.
Mistakes in the benchmark itself
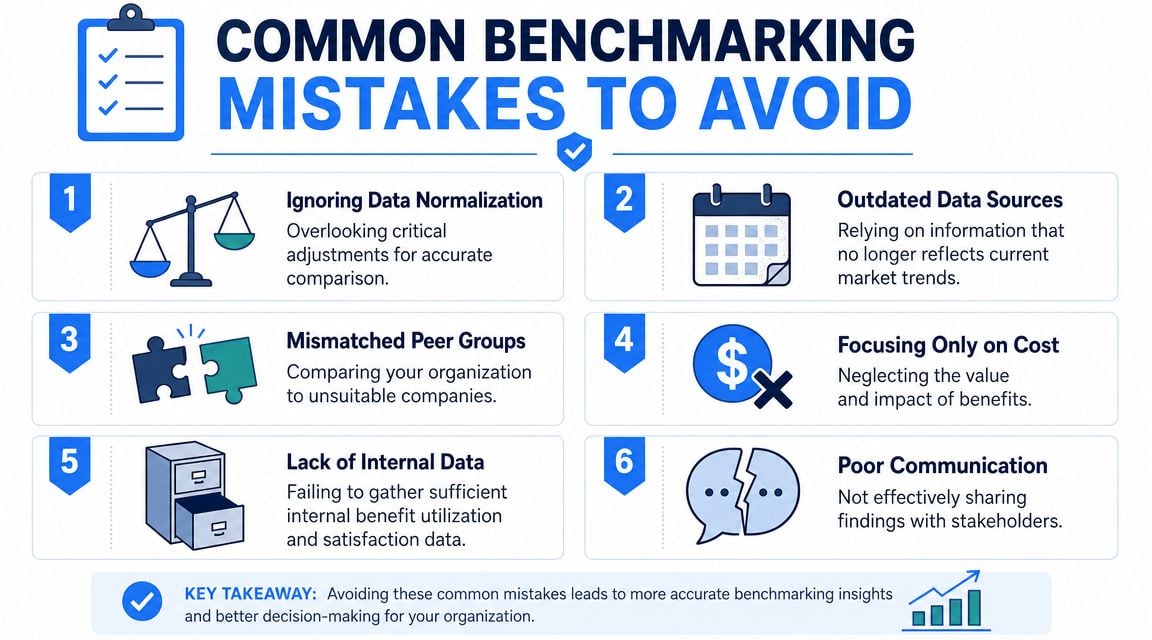
The most common technical error is using data that doesn't match the company. A national comparison for a local employer, a large-employer data set for a smaller workforce, or a broad industry cut for a niche hiring profile will all distort the result.
Another frequent problem is relying on stale information. Renewal decisions move too quickly for old assumptions to stay reliable. If the team can't verify that the benchmark reflects the current market well enough to guide a present decision, it should be treated as directional only.
A third issue is incomplete internal data. If enrollment, tier mix, or employee deductions are messy, external benchmarking won't fix that. It only gives false confidence.
Mistakes in interpretation
Interpretation errors are usually more expensive than spreadsheet errors.
One common mistake is treating premium as the whole story. An independent review of employee benefits benchmarking for cost control notes that a sound workflow identifies where spend deviates from market norms to target renegotiation, and warns against relying only on headline premium costs instead of full program economics or ignoring ongoing claims trends in renewal strategy. That shows up in practice when a company chooses the “cheaper” option but misses weak contribution strategy, poor utilization, or hidden cost in plan design.
Other interpretation mistakes include:
- Ignoring take-up rates: A plan may look affordable to the employer because employees aren't enrolling.
- Comparing the wrong market: PEO medical pricing should not be judged against a random small-group quote without accounting for the buyer's actual alternative.
- Overvaluing plan richness: Better coverage isn't automatically better value if the fee load is excessive.
- Missing contract effects: A decent benefits package can still be a weak deal if renewal protections, credits, or service commitments are poor.
“Competitive benefits” is not a conclusion. It's a hypothesis that has to survive financial review.
A valid benchmark should make the errors obvious before the company negotiates, not after.
Turning Your Benchmark Findings Into Negotiation Leverage
A benchmark has no value if it ends as an internal document no one uses. The point is its use.
That advantage works best when the company translates the findings into a short set of asks tied to evidence. Not a vague complaint about rising costs. Not a general statement that employees want better benefits. Specific requests based on where the economics or competitiveness are off.
Bring a position, not a complaint
The most effective negotiation posture is calm and narrow. A company doesn't need to prove the provider is wrong about everything. It only needs to show where the current package is misaligned with the market or with the company's priorities.
That usually sounds like this:
- Contribution gap script: The benchmark shows the current employer contribution is weaker than the relevant peer set. The company wants options to improve affordability without destabilizing the full benefits budget.
- Fee pressure script: The package may be acceptable on plan design, but the administrative load makes the total economics hard to justify. The company wants revised fee treatment, credits, or stronger renewal terms.
- Plan design script: Participation and employee feedback suggest the current menu isn't fitting the workforce. The company wants alternate plan structures, not just a repriced version of the same design.
Companies preparing for those conversations often benefit from reviewing how PEO benefits negotiation leverage works in practice because contract structure and concession strategy matter just as much as the medical comparison.
Ask for trade-offs that change the economics
The strongest negotiations focus on items the provider can move. A team that asks only for “better pricing” usually gets a generic answer. A team that asks for specific trade-offs has a better chance of improving the deal.
Useful asks often include:
- Administrative fee relief: Especially when the benefits package is merely average.
- Rate stability protections: Valuable when volatility is the bigger concern than first-year cost.
- Implementation credits: Useful if switching friction is part of the buyer's hesitation.
- Plan alternatives: Sometimes a better-fit option solves more than a discount would.
- Renewal guardrails: Important when the current issue is less about today's price and more about future exposure.
The benchmark should also shape what not to ask for. If the company is already below market on employer contributions, pushing only for lower cost can create a recruiting problem. If the plans are strong but service is weak, negotiation should focus on accountability and support terms.
A good benchmark gives leadership language like this: the company is willing to pay for value, but not for opacity, unnecessary fee load, or a plan structure that doesn't fit the workforce. That's a much stronger position than saying the renewal feels high.
Companies that want an independent second look before renewing, switching, or negotiating can use PEO Metrics to compare PEO pricing, benefits, contract terms, and service trade-offs side by side. The process helps HR and finance teams understand total cost, spot hidden risk, and go into negotiations with a clearer position.
