
A striking reality sits behind most PEO buying decisions. In North America, the PEO market reached USD 6.86 billion in 2025 and is projected to reach USD 10.43 billion by 2031, while penetration has already reached 14% among employers with 20 to 499 employees and 15% among companies with 50 to 99 employees, according to North America PEO market data from Mordor Intelligence. That matters because a PEO is no longer a niche outsourcing choice. For many small and mid-sized employers, it has become a standard operating model for payroll, benefits, and compliance.
That scale changes how buyers should evaluate peo examples. Generic descriptions of “better HR support” aren’t enough when the contract may include onboarding fees, annual admin charges, state setup work, and renewal language that affects total cost far more than the headline rate. The strongest examples show what changed, how long implementation took, what got consolidated, and where the financial advantage came from.
Why real PEO examples drive better decisions is simple. High-stakes PEO choices hinge on tangible results. These eight profiles break down services, fees, timelines, and measurable outcomes so CFOs and HR leaders can see what to expect and negotiate from a stronger position.
Table of Contents
- 1. Mid-Market Manufacturing Firm Reduces HR Overhead by $180K Annually While Scaling to 12 States
- 2. Tech Startup Cuts Benefits Administration Costs by 45% While Improving Employee Retention During Series B Growth
- 3. Regional Healthcare Network Achieves HIPAA Compliance Across 8 Clinics While Reducing Payroll Processing Cost by 35%
- 4. Retail Franchise Group Standardizes Benefits and Payroll Across 340 Employees in 5 States, Improving Franchisee Profitability by $92K
- 5. E-Commerce Distributor Achieves 100% Compliance in 15 States While Reducing Workers’ Compensation Costs by $58K Annually
- 6. Professional Services Firm Improves Partner-Level Profitability by $120K via PEO Cost Savings and Headcount Optimization
- 7. Food and Beverage Franchise Successfully Scales to 6 New States in 18 Months Using PEO Compliance Infrastructure
- 8. PE-Backed Platform Consolidation Standardizes HR Across 8 Acquired Companies Using PEO Shared Services Model
- 8 PEO Case Comparisons
- Key Takeaways & Next Steps
1. Mid-Market Manufacturing Firm Reduces HR Overhead by $180K Annually While Scaling to 12 States
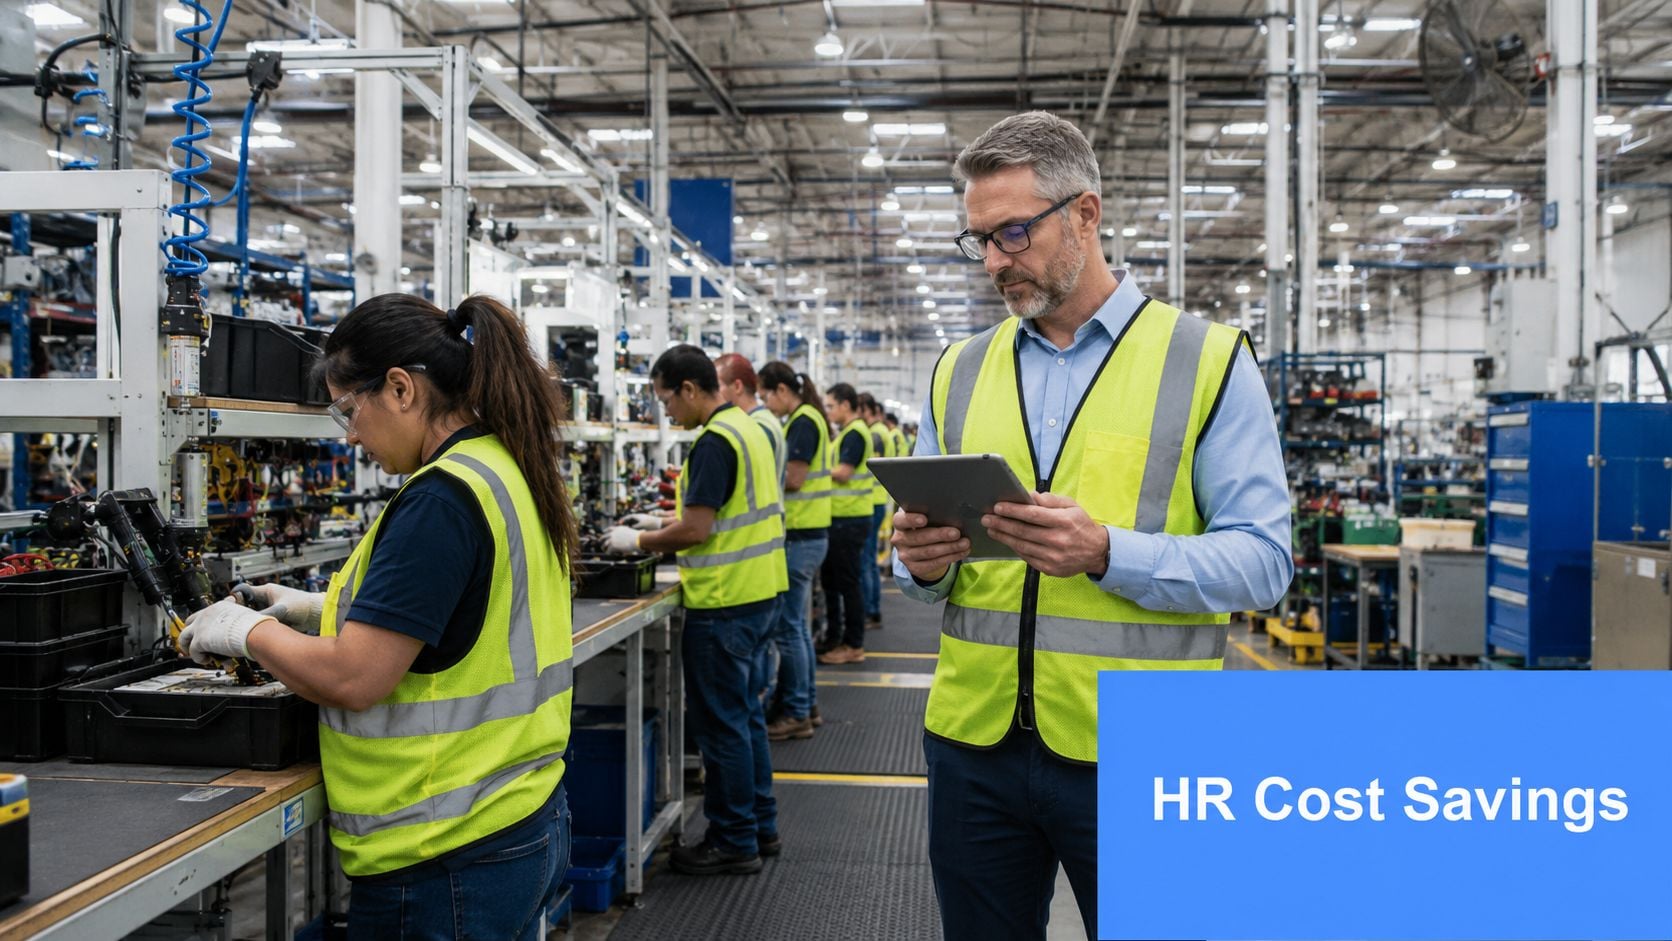
A 450-employee manufacturer in the Midwest had a common mid-market problem. The company could still run HR internally in six states, but the planned move into 12 states would have forced more payroll, compliance, and benefits administration headcount before revenue from the expansion fully arrived.
The company evaluated three national PEOs and selected a provider with stronger multi-state payroll coverage for manufacturing. Implementation took 90 days. In the first year, the company eliminated one HR generalist role, consolidating work that had been split across payroll follow-up, benefits troubleshooting, and state compliance tracking. That role had a $65,000 salary and a 30% benefits burden, which produced $84,500 in loaded savings.
What changed in the operating model
The PEO’s all-in annual fee landed at $95.5K after a $25K implementation credit reduced a first-year cost that otherwise would have been $120.5K. Consolidated benefits administration and automated compliance monitoring supported entry into the next wave of states without adding internal HR staff. Net first-year savings reached $180K, with an additional $120K projected in year two once the expansion launched without incremental headcount.
This is the kind of peo example that exposes where buyers often miss the advantage. The value wasn’t just “outsourced HR.” It was timing. The company bought compliance capacity before expansion instead of hiring permanent staff ahead of uncertain growth.
Practical rule: If a company is adding states, the PEO should map costs and responsibilities state by state before signature. That includes setup, tax registration support, ongoing payroll handling, and any separate charge for local compliance administration.
Negotiation lesson
At renewal 18 months later, the company used competitor quotes again and locked a 12% discount renewal rate at $84K instead of accepting a projected increase. That move mattered more than the original implementation credit because it improved the cost structure for the full contract term.
For manufacturers, rate protection is usually more valuable than a flashy demo. A buyer planning headcount growth should also ask for a detailed savings model tied to current HR staffing and state footprint. The deeper benchmark is whether the provider can replace or defer internal hires, not whether its admin fee looks modest on page one. Manufacturing buyers weighing similar trade-offs can compare this logic against labor cost optimization using PEO for manufacturing firms.
2. Tech Startup Cuts Benefits Administration Costs by 45% While Improving Employee Retention During Series B Growth

A 120-person SaaS company heading into Series B growth had an infrastructure mismatch. Payroll ran through a basic cloud provider, while medical, dental, and vision administration sat with separate vendors and manual enrollment workarounds. The stack functioned, but it consumed too much staff time for a company that needed to hire quickly.
The move to a PEO with integrated benefits technology took eight weeks. After the switch, total annual benefits and payroll administration costs fell from $68K to $37.4K. The company’s first-year all-in PEO fee was $47.8K, and net year-one savings reached $20.2K after fragmented vendor costs were removed. By year two, once the PEO rate was locked, net savings rose to $30.6K.
Why the savings showed up fast
This case works because the cost problem wasn’t only vendor invoices. It was coordination. Three carriers meant duplicated employee communication, repeated eligibility work, and more open-enrollment support. Consolidating those functions onto one platform cut direct costs and reduced friction during onboarding.
The startup also improved employee benefits satisfaction from 62 to 90 on a 100-point scale within six months. That kind of improvement is especially useful during fundraising and hiring cycles because employee retention pressure tends to rise when companies scale before managers and systems mature.
Contract lesson for fast-growth teams
The strongest negotiation point in this peo example wasn’t the base fee. It was implementation alignment. Fast-growth companies should push for a 90-day implementation window that matches either the fiscal year or open enrollment cycle. Otherwise, finance and HR teams can end up running overlapping systems and doing duplicate enrollment work.
A second lesson is technological, not legal. TriNet notes that high-value PEO performance management depends on integrated HR technology, mobile accessibility, ERP integration capability, data security, multi-location support, and clear pricing without hidden fees in the agreement, as outlined in TriNet’s guidance on PEO performance management. That framework explains why this startup’s gains showed up so quickly. The software architecture mattered as much as the service team.
For tech buyers focused on retention, this scenario pairs naturally with PEO strategies for employee retention.
3. Regional Healthcare Network Achieves HIPAA Compliance Across 8 Clinics While Reducing Payroll Processing Cost by 35%

A healthcare staffing network with 280 employees across eight clinics faced a payroll problem that looked administrative but was really regulatory. Shift-based scheduling, state-specific licensing, and protected employee data made basic payroll processing slow and risky. Internal processing took 12 hours each week and still left compliance blind spots.
The company chose a healthcare-focused PEO and moved to centralized timekeeping linked directly to payroll. Processing time fell to three hours a week. The annual PEO fee was $68K, and the company eliminated a part-time payroll assistant role worth $28K while avoiding the need to hire a dedicated compliance officer estimated at $75K.
Where the economics came from
Over 18 months, total savings reached $145K through avoided salary cost and fewer payroll corrections. Payroll errors fell from 6 to 8 per cycle to fewer than 1. The company also completed a state regulatory audit with no compliance violations.
The most useful lesson here isn’t that a PEO can “help healthcare firms.” It’s that healthcare buyers should treat payroll and privacy as one workflow. If the timekeeping system, payroll engine, and access controls are separate, the organization usually ends up paying twice. Once in staff time, then again in audit exposure.
Healthcare groups should ask the PEO to document how licensing verification, timekeeping, payroll approvals, and access controls connect across locations. In this sector, process gaps create legal risk faster than pricing gaps.
What healthcare buyers should press on
This buyer negotiated a 15-month rate lock and a $12K implementation credit, equal to 17.6% of the first-year fee. That was possible because the company could show competing offers and a clear clinic footprint. Healthcare operators often underestimate this advantage.
Confidentiality and workflow control are paramount. The service agreement should specify data handling responsibilities, user permissions, and escalation procedures for payroll disputes or access incidents. Buyers reviewing those issues in detail should compare the contract language against broader HR confidentiality law considerations.
4. Retail Franchise Group Standardizes Benefits and Payroll Across 340 Employees in 5 States, Improving Franchisee Profitability by $92K
A 12-unit retail franchise network had a structural problem that many franchise systems ignore too long. Each franchisee handled payroll differently, benefits offerings varied, and compliance discipline depended on the individual operator rather than the brand.
The franchisor implemented a shared-services PEO model across 340 employees in five states. The annual PEO cost was $72K. That replaced independent payroll processors averaging $6K per location, or $72K across the system, while also reducing administrative work by four hours per week at each location.
Why franchise structures benefit from standardization
Implementation took 10 weeks and required data migration across all 12 franchisees. Within the first year, the network produced $92K in collective savings from processor elimination and reduced administrative overhead. Turnover also fell by 18% after benefits and payroll practices became more consistent.
That consistency is the strategic value. Franchisees usually focus on local P&L, but franchisors should focus on operating variance. When payroll and benefits differ unit by unit, the brand pays through uneven compliance, uneven recruiting, and weaker support for new franchise sales.
Negotiation lesson for franchisors
The group secured a $10.8K implementation credit, equal to 15% of the first-year fee, by offering a multi-year commitment and clean payroll data. More important, the franchisor allocated cost centrally so each franchisee could see that the PEO replaced what they were already paying for payroll, while adding compliance and benefits administration.
A franchise agreement with a PEO should also allow unit additions and removals without penalty. That clause matters because franchise systems rarely stay static. For operators expanding the network itself, disciplined HR infrastructure supports franchise development just as much as site selection or training.
Deal point to push: The franchisor should control reporting, escalation paths, and cost allocation schedules. If those stay informal, the PEO relationship can become another source of franchisee conflict instead of a stabilizing system.
5. E-Commerce Distributor Achieves 100% Compliance in 15 States While Reducing Workers’ Compensation Costs by $58K Annually
A 620-employee e-commerce distributor had fulfillment centers in 15 states and a workers’ compensation profile that was getting expensive fast. The company’s rate averaged $18.50 per $100 of payroll, and prior compliance issues had already triggered penalties and premium pressure.
The chosen national PEO bundled payroll compliance, workers’ compensation underwriting, loss prevention, and injury reporting. That combination matters because workers’ comp savings usually don’t come from the administrative fee. They come from risk control and claims discipline.
The hidden value was in workers’ comp
Within 14 months, the PEO’s safety and loss-prevention work reduced workplace injuries by 41%. That helped drive the workers’ compensation premium down from $18.50 to $13.95 per $100 of payroll. With annual payroll around $28 million, the company generated $145K in annual insurance savings against an $87K all-in PEO fee, leaving a net first-year benefit of $58K.
The company also cleared the next two regulatory audits with no compliance violations. In practical terms, this is one of the clearest peo examples of why CFOs should read beyond the admin fee. The actual spend was in underwriting and claim trends.
The underlying pricing mechanics support that conclusion. PEO Benefit Partners notes that the admin fee often ranges from $80 to $200 per employee per month, while health and voluntary benefits often run $200 to $800+ per employee per month, and workers’ compensation can range from 0.5% to 15%+ of payroll depending on industry and claims history, as explained in its PEO pricing guide.
How to test whether a PEO can really lower claims cost
This distributor secured a $15K implementation credit and a $12K annual safety program credit after sharing loss history and committing to a three-year term. That negotiation worked because the company gave the PEO enough underwriting detail to price the risk confidently.
Buyers with large workers’ comp exposure should ask for a three-year loss-prevention roadmap and pre-audit compliance reviews before known state visits. A national footprint alone doesn’t prove the provider can manage warehouse or fulfillment risk well. Buyers operating across jurisdictions can pressure-test that fit through multi-state workers’ comp consolidation through a PEO compliance framework.
6. Professional Services Firm Improves Partner-Level Profitability by $120K via PEO Cost Savings and Headcount Optimization
A 185-person consulting and accounting firm approached the PEO decision differently. The issue wasn’t only compliance. It was margin structure. Administrative overhead for payroll, benefits, and HR consumed 8.2% of revenue, which translated to $1.52 million annually against revenue of roughly $18.5 million.
The firm had three internal HR and payroll FTEs, but too much of their time was stuck in transaction work. A PEO with professional-services experience took over the repetitive administration, allowing the firm to reduce internal headcount to 1.5 FTEs. The annual PEO fee was $98K.
Why this example is different
The staffing impact drove the economics. One eliminated benefits administrator role produced $65K in salary savings plus $20.5K in benefits. Another $22K came from redirecting senior internal time away from administrative work and back toward billable activity. Total first-year savings reached $107K, and annual savings rose to $120K in year two after adoption stabilized.
This is a useful contrast to startup and franchise peo examples. The main benefit here wasn’t lower vendor spend or easier compliance across locations. It was improving the percentage of time high-value employees spent on work clients pay for.
What to negotiate in this model
The firm negotiated a $14.7K implementation credit and a three-year rate lock with 2% annual increases. It also secured discounted access to executive HR consulting instead of paying outside advisers at $250 per hour.
For firms with partnership economics, the better negotiation question is not “What is the PEPM price?” It’s “Which internal tasks disappear, and which senior staff hours get reallocated?” That answer determines whether the PEO improves partner profitability or instead shifts overhead from one vendor line to another.
This type of buyer should also benchmark against broad PEO outcome data. National PEO research states that half of all PEO clients have between 10 and 49 employees, another 35% have fewer than 10 employees, and sectors with high penetration include professional services and financial and insurance businesses, according to NAPEO industry research and data. That concentration makes sense because these firms tend to value margin protection and compliance precision more than oversized HR teams.
7. Food and Beverage Franchise Successfully Scales to 6 New States in 18 Months Using PEO Compliance Infrastructure
A multi-unit food service franchise started with 280 employees in four states and planned to reach about 650 employees across 10 states within 18 months. The key risk wasn’t hiring. It was building enough payroll tax, wage-and-hour, and benefits infrastructure to support new units without slowing openings.
The franchisor chose a PEO experienced in restaurant and franchise operations. The initial annual fee was $68K and rose to $142K as headcount reached 650. In exchange, the company avoided building an internal expansion-era people function from scratch.
The contract mattered as much as the service
The avoided staffing cost was substantial. Instead of hiring a VP of People Operations at $140K salary plus $42K in benefits and two regional HR coordinators costing $110K plus $33K in benefits, the franchise saved $325K in compensation over 18 months. The company also avoided compliance issues during the expansion period and accelerated the opening plan by four months because onboarding and state setup no longer depended on internal HR capacity.
The negotiation terms made that possible. The franchise secured a $12K implementation credit, a tiered pricing model that lowered per-employee cost from $243 at 280 employees to $219 at 650 employees by year two, and a three-year contract with 2% annual increases.
Expansion lesson
This example shows why growth-stage buyers should negotiate on the future headcount curve, not current size. The PEO fee looked different at 280 employees than at 650, and the contract recognized that upfront.
There’s also a useful market context behind this. North America PEO penetration is already strong among employers in the small and mid-sized range, and that reflects a basic truth. Companies at this size often can’t absorb payroll complexity, benefits procurement, and labor-law management internally at the pace expansion demands, as reflected in the market projections and penetration figures noted earlier.
For restaurant and franchise operators, the practical move is to evaluate PEOs six to 12 months before the first new-state launch. That gives enough time to build a state-by-state rollout plan and test whether the provider understands sector-specific labor rules rather than just offering a national sales footprint.
8. PE-Backed Platform Consolidation Standardizes HR Across 8 Acquired Companies Using PEO Shared Services Model
A private equity-backed platform company acquired eight operating businesses over three years, reaching 1,240 employees in 12 states. Each business brought its own systems and habits. Before consolidation, the group operated across six payroll vendors, four benefits platforms, and inconsistent compliance processes.
The platform could have invested heavily in legacy-system integration. Instead, it used a PEO shared-services model to standardize payroll, benefits, and compliance on one operating layer. The annual PEO fee was $156K, with per-employee cost at $126 because of scale.
Why the shared-services model worked
The immediate savings came from simplification. The platform eliminated separate payroll vendor spend worth $72K annually and reduced duplicate HR staffing by 3.2 FTE-equivalent roles worth $140K annually. Net first-year savings reached $56K, and by year two, deeper consolidation pushed annual savings to $185K.
That second-year jump is the most important part of the example. Many acquirers expect the PEO to create value immediately through pricing alone. In practice, the bigger gain often arrives later, once the platform uses shared reporting, common workflows, and a centralized operating model.
PE lesson on leverage
The company negotiated this structure by committing to a five-year contract, accepting a shared support model instead of dedicated contacts for each business, and standardizing on the PEO’s default benefits and payroll processes. Those concessions bought a 38% per-employee discount relative to $200+ national PEO pricing often seen at smaller group sizes.
This is also where contract scrutiny becomes critical. Verified industry material notes that setup or onboarding fees often range from $500 to $2,000, recurring annual administrative fees typically start at $2,500, and firms with 50 to 99 employees can often secure per-employee pricing between $95 and $140, while groups under 20 employees usually pay a premium of $130 to $200 PEPM, according to Native Teams pricing analysis on professional employer organizations. In other words, scale matters, but only if the buyer is willing to standardize operations enough for the PEO to serve the group efficiently.
For acquirers focused on post-deal harmonization, benefits harmonization after acquisition using PEO is the natural extension of this model.
8 PEO Case Comparisons
| Title | Implementation complexity | Resource requirements | Expected outcomes | Ideal use cases | Key advantages |
|---|---|---|---|---|---|
| Mid-Market Manufacturing Firm Reduces HR Overhead by $180K Annually While Scaling to 12 States | Moderate–high: 90‑day rollout, data cleanup, parallel payroll runs | PEO fee $95.5K/yr; eliminated 1 HR FTE; manufacturing WC underwriting required | Net first‑year savings ~$180K; payroll time 4h→30m; multi‑state compliance for 12 states | Mid‑market manufacturers entering new states with complex payroll/tax needs | Reduced HR headcount, consolidated benefits, automated multi‑state compliance |
| Tech Startup Cuts Benefits Administration Costs by 45% While Improving Employee Retention During Series B Growth | Low–moderate: 8‑week rollout; HRIS integrations may need custom config | First‑year PEO cost ~$47.8K; $6K custom integration; avoids hiring HR admin | Benefits admin cost cut 45%; satisfaction +28 points; improved retention | Scaling startups needing benefits consolidation without adding HR headcount | Vendor consolidation, automated enrollment, predictable benefits costs |
| Regional Healthcare Network Achieves HIPAA Compliance Across 8 Clinics While Reducing Payroll Processing Cost by 35% | High: 12‑week HIPAA configuration, manager retraining | PEO fee $68K/yr; eliminated part‑time payroll assistant; avoided compliance officer hire | Payroll time −75%; payroll errors −92%; $145K avoided costs over 18 months; zero audit violations | Healthcare networks with licensing, shift scheduling, and HIPAA requirements | HIPAA‑compliant payroll, licensing workflows, audit‑ready compliance |
| Retail Franchise Group Standardizes Benefits and Payroll Across 340 Employees in 5 States, Improving Franchisee Profitability by $92K | Moderate: 10‑week rollout across 12 franchisees; change management needed | PEO fee $72K/yr (network); eliminated franchisee payroll processors ($72K saved) | Collective first‑year savings $92K; admin time −4h/location/week; turnover −18% | Multi‑unit franchise networks standardizing benefits/payroll across locations | Standardized benefits, franchisor oversight, improved franchisee profitability |
| E‑Commerce Distributor Achieves 100% Compliance in 15 States While Reducing Workers’ Compensation Costs by $58K Annually | Moderate–high: 14 months to realize full benefits; safety program rollout | PEO fee $87K/yr; safety training time investment; potential implementation credits | Workplace injuries −41%; WC premium −24.6%; $145K insurance savings; net $58K first‑year benefit | Large multi‑state distributors with high workers’ comp exposure | Integrated WC underwriting, loss prevention, centralized compliance monitoring |
| Professional Services Firm Improves Partner‑Level Profitability by $120K via PEO Cost Savings and Headcount Optimization | Moderate: 12‑week scoping for complex compensation and partnership structures | PEO fee $98K/yr; internal HR headcount reduced (3→1.5 FTE) | First‑year savings $107K; year‑2 ≈ $120K; partner profit +$1.8–2.1K each | Professional services firms with leverage model and complex comp structures | Headcount optimization, shift from transactional to strategic HR, partner‑focused benefits |
| Food and Beverage Franchise Successfully Scales to 6 New States in 18 Months Using PEO Compliance Infrastructure | High: 10‑week transition; multi‑state tax/setup across 10 states; dual payroll runs | PEO fee $68K→$142K as headcount grows; avoided VP + 2 coordinators ($240–260K avoided) | Avoided $240K+ staffing costs; expansion accelerated 4 months; zero violations | Restaurant/franchise groups planning rapid multi‑state expansion | Rapid location onboarding, multi‑state compliance, scalable HR capacity |
| PE‑Backed Platform Consolidation Standardizes HR Across 8 Acquired Companies Using PEO Shared Services Model | High: staggered 6‑month implementation across 8 companies; complex data migration | PEO fee $156K/yr; eliminated vendors ($72K) and 3.2 FTEs ($140K) | Net first‑year savings $56K; year‑2 savings $185K; consistent portfolio HR metrics | PE roll‑ups needing fast HR standardization across acquisitions | Scale economies, centralized analytics, faster acquisition onboarding |
Key Takeaways & Next Steps
These peo examples point to four patterns that matter more than most buyers expect.
First, implementation economics often matter more than listed admin fees. Several of these companies won value through implementation credits, phased rollout structures, or headcount-based pricing that improved as growth arrived. That’s why a headline quote rarely tells the full story. For small employers, even the baseline cost range can be meaningful. For a 10-employee company with average salaries, annual PEO cost typically ranges from $10,000 to $19,200, or roughly $830 to $1,600 per month, and groups under 20 employees often pay a higher per-head rate than larger employers, based on FirstHR’s per-employee PEO cost breakdown.
Second, buyers should evaluate the full ROI model, not just direct fee replacement. Verified data from NAPEO-linked analysis states that the average ROI of working with a PEO is 27.2% in cost savings alone, with an average client saving $1,272 for every $1,000 spent, yielding a net benefit of $272 per $1,000 invested, according to this compiled PEO ROI analysis. Another verified summary states that companies switching to a PEO can reduce HR administrative costs by about $450 less per employee per year compared with non-users, and that the gross average annual return in cost reduction alone is more than 27.3%, according to Axcet HR’s summary of NAPEO cost findings. Those numbers shouldn’t be used as guarantees, but they do create a benchmark for financial diligence.
Third, contract risk deserves the same scrutiny as service scope. Verified white-paper material notes that unexpected renewal fees and restrictive termination clauses are a major reason companies switch PEOs, and that many mid-market firms end up paying materially more than quoted after implementation when contract terms aren’t negotiated carefully, as discussed in the NAPEO 2025 white paper on PEO clients. That makes renewal caps, termination terms, annual fee definitions, and implementation scope just as important as benefits design or payroll technology.
The cleanest RFPs don’t just ask what the PEO includes. They ask which costs can rise, which fees appear later, which services are excluded, and what happens when the company exits.
Fourth, market adoption and business outcomes suggest that PEOs are no longer just for very small employers. In the United States alone, the industry market size is estimated at $254.8 billion in 2026, with 6,675 businesses operating in the sector and approximately 4 million people employed through PEO-supported businesses in the U.S., according to the Mordor Intelligence market reference cited earlier. NAPEO tracking also reports stronger growth expectations among PEO users than non-users. The practical implication is clear. Buyers aren’t evaluating an experimental model. They’re evaluating a mature market where negotiating skill directly shapes outcome quality.
A useful next step is to benchmark any current or proposed PEO agreement against the patterns in these examples. That means checking for implementation credits, multi-year rate locks, tiered pricing tied to headcount, state expansion roadmaps, support model clarity, and exit language that won’t create expensive surprises later. The more specific the company gets about internal staffing savings, benefits consolidation, workers’ comp exposure, and rollout timing, the stronger its advantage becomes.
PEO Metrics helps HR, finance, and leadership teams compare, select, and negotiate the right PEO with independent side-by-side analysis of pricing, benefits, contract terms, service quality, compliance support, and industry fit. Companies evaluating a first PEO, switching providers, or renegotiating an existing agreement can use PEO Metrics to identify the strongest options, benchmark total cost, surface contract risks, and negotiate better terms at no cost to the buyer.
