Breakdowns of PEO pricing models, fee structures, hidden costs, and long-term financial impact. Includes comparisons between percentage-of-payroll and per-employee pricing models.
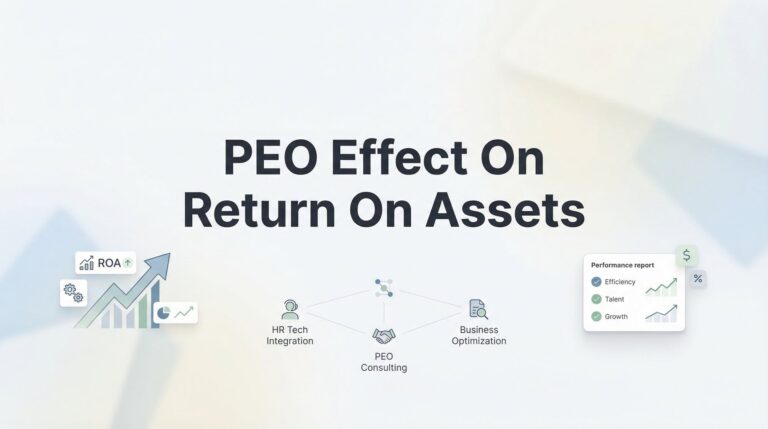
Partnering with a Professional Employer Organization (PEO) can directly impact your return on assets by reducing administrative overhead, minimizing compliance risks, and allowing you to redeploy capital more efficiently. While most PEO discussions focus on operational benefits, understanding the PEO effect on return on assets helps translate HR outsourcing into concrete financial metrics that matter to investors and lenders, showing how strategic workforce management decisions improve your b…
A comprehensive PEO financial modeling template must account for more than simple fee comparisons—it requires capturing bundled services, variable admin costs, pass-through expenses, and workforce-specific benefit savings that standard spreadsheets miss. This guide breaks down seven essential components that provide complete cost visibility, including hidden internal HR labor, insurance premium differentials, and operational efficiency factors that determine whether a PEO investment delivers …
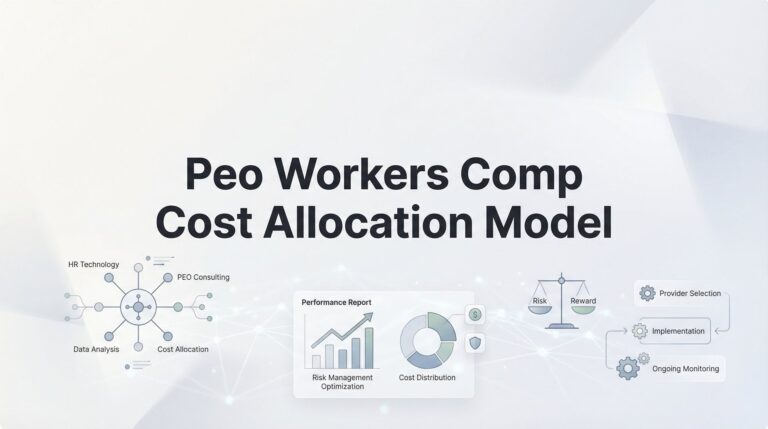
PEOs use three distinct workers comp cost allocation models that determine whether you pay based on your actual claims, share costs across a pooled group, or fall somewhere in between. Understanding which PEO workers comp cost allocation model your provider uses is critical because the pricing structure—not just the quoted rate—directly impacts whether you’re getting fair pricing or unknowingly subsidizing other companies’ workplace injuries.
Most business owners miss hidden HR infrastructure costs when evaluating PEO services by focusing solely on monthly fees. This guide presents seven practical strategies for conducting a thorough PEO HR infrastructure cost analysis, helping you compare your current expenses—including payroll systems, benefits platforms, compliance tools, HRIS software, and staffing—against a PEO’s complete cost structure to identify real savings and hidden expenses.
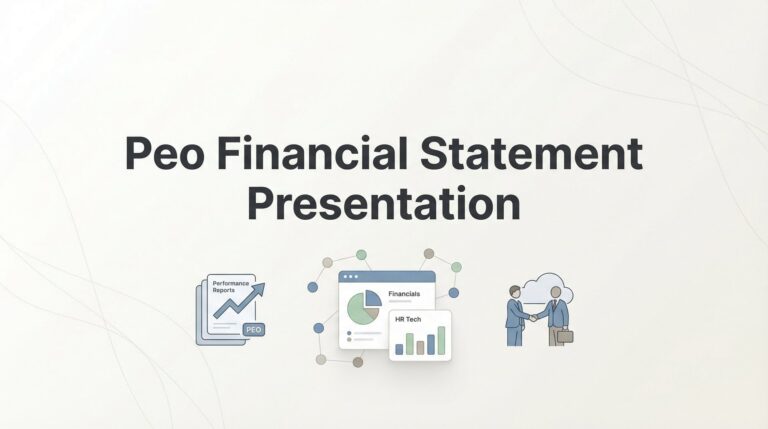
When your PEO sends a single bundled invoice covering wages, taxes, benefits, and fees, proper financial statement presentation becomes critical for accurate reporting. This guide shows you how to break down that consolidated PEO invoice into the correct general ledger accounts—separating gross wages, payroll taxes, benefits, and administrative fees—so lenders, investors, and your management team can see true labor costs and make informed decisions without reconciliation headaches.
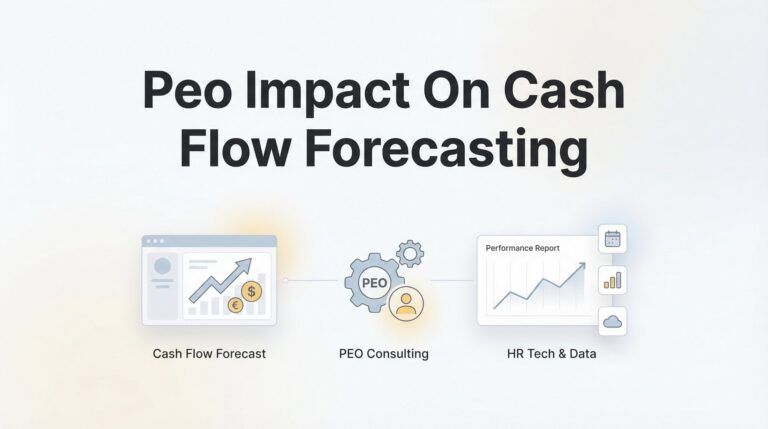
Switching to a PEO fundamentally changes your cash flow patterns by consolidating payroll, taxes, benefits, and insurance into a single billing cycle—but most businesses don’t update their forecasting models to match. Understanding the PEO impact on cash flow forecasting means rebuilding your financial planning assumptions around new payment timing and structures, not just budgeting for a new vendor expense.
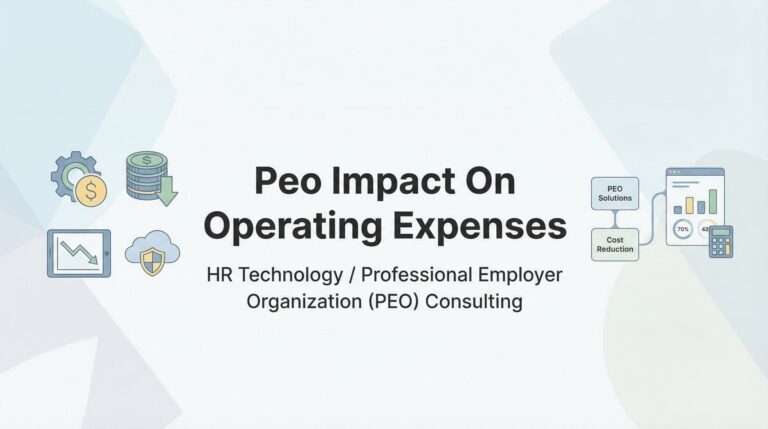
PEO impact on operating expenses isn’t about blanket savings—it’s about restructuring costs across payroll, benefits, HR infrastructure, and compliance. This breakdown shows exactly where PEOs reduce expenses, where hidden costs appear, and how to evaluate whether consolidating these functions creates real efficiency or simply shifts costs with added markup, helping business owners make data-driven decisions beyond the typical sales pitch.
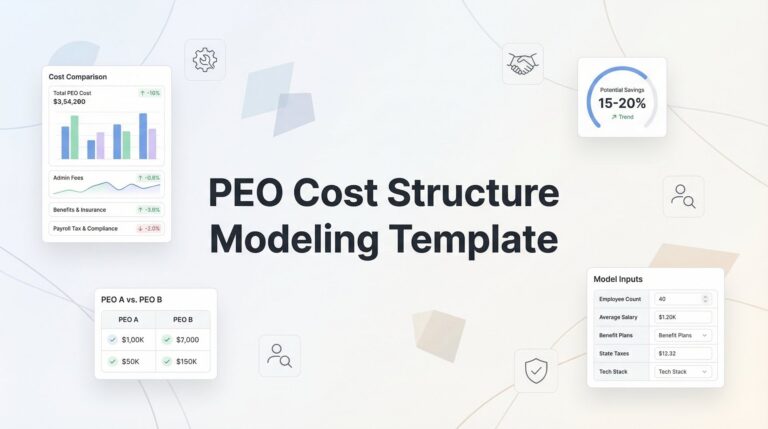
A PEO cost structure modeling template helps businesses move beyond blind price comparisons by breaking down every fee component and projecting costs across different scenarios. Instead of comparing generic quotes, this structured framework reveals which PEO provider actually costs less for your specific business situation by first establishing your current HR cost baseline, then systematically analyzing administrative fees, per-employee charges, benefit markups, and hidden costs to make data…
Switching to a PEO doesn’t automatically improve your gross margin—the actual effect depends on how your accountant categorizes PEO fees and whether those costs replace COGS labor expenses or get added as operating expenses. Understanding the PEO effect on gross margin requires knowing exactly where bundled labor costs, workers’ comp, and administrative fees land on your P&L, because the arrangement might simply shift expenses around rather than genuinely improve profitability.

When you outsource HR to a PEO, the impact on working capital goes beyond simple cost comparisons. The PEO effect on working capital stems from fundamental changes in how money flows through your business—including payroll funding timing, benefits premium structures, and workers’ comp deposit requirements. These cash flow mechanics become especially critical for businesses with tight cash positions, seasonal revenue patterns, or rapid scaling, potentially creating either financial flexibility…
