Breakdowns of PEO pricing models, fee structures, hidden costs, and long-term financial impact. Includes comparisons between percentage-of-payroll and per-employee pricing models.
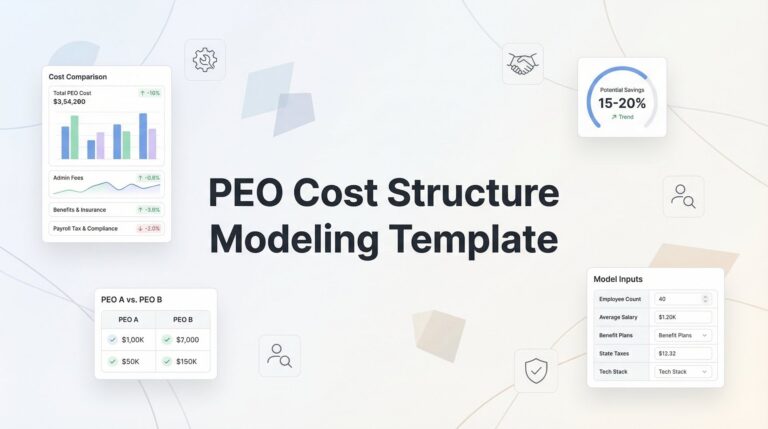
A PEO cost structure modeling template helps businesses move beyond blind price comparisons by breaking down every fee component and projecting costs across different scenarios. Instead of comparing generic quotes, this structured framework reveals which PEO provider actually costs less for your specific business situation by first establishing your current HR cost baseline, then systematically analyzing administrative fees, per-employee charges, benefit markups, and hidden costs to make data…

Switching to a PEO doesn’t automatically improve your gross margin—the actual effect depends on how your accountant categorizes PEO fees and whether those costs replace COGS labor expenses or get added as operating expenses. Understanding the PEO effect on gross margin requires knowing exactly where bundled labor costs, workers’ comp, and administrative fees land on your P&L, because the arrangement might simply shift expenses around rather than genuinely improve profitability.

When you outsource HR to a PEO, the impact on working capital goes beyond simple cost comparisons. The PEO effect on working capital stems from fundamental changes in how money flows through your business—including payroll funding timing, benefits premium structures, and workers’ comp deposit requirements. These cash flow mechanics become especially critical for businesses with tight cash positions, seasonal revenue patterns, or rapid scaling, potentially creating either financial flexibility…
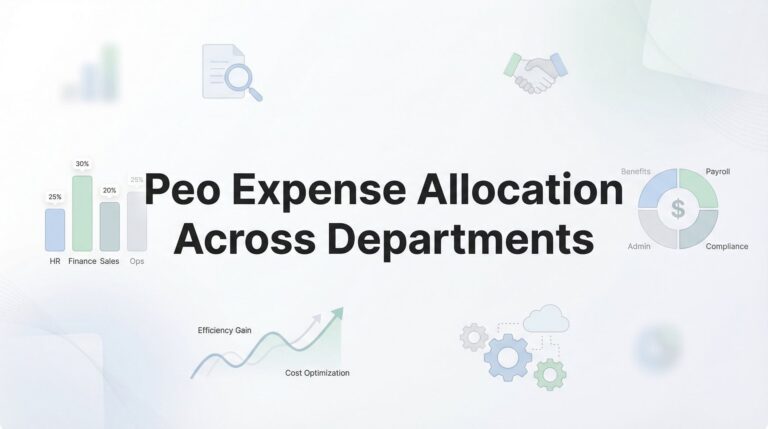
Most businesses treat their PEO invoice as one undifferentiated expense, but this approach masks significant cost variations between departments with different headcounts, salary levels, and risk profiles. This practical guide shows you how to implement PEO expense allocation across departments to gain accurate visibility into true departmental costs and profitability, moving beyond theoretical accounting to create a system that reveals where your HR dollars actually go.
PEO providers deliberately obscure their pricing structures, making it nearly impossible to compare costs or understand what you’re actually paying for. This guide exposes the two core PEO pricing models, reveals hidden fees like setup costs and benefits markups that only appear after signing, and shows you how to calculate your true total cost—so you can evaluate quotes accurately and avoid overpaying for “full-service” HR that isn’t what it seems.
Understanding the PEO impact on labor burden calculation is essential before partnering with a professional employer organization. This comprehensive guide breaks down how to calculate your true labor costs with and without a PEO, revealing which expenses disappear, which get bundled into PEO fees, and which remain your responsibility—giving you concrete numbers to evaluate whether a PEO arrangement makes financial sense for your business.
Before committing to a PEO, you need reliable methods to calculate actual insurance pooling savings—not just the vague percentages sales reps promise. This guide provides seven practical approaches to estimate your potential savings using a PEO insurance pooling savings estimator, from quick calculations to detailed analyses, helping you build a defensible business case based on your company’s specific rates, claims history, and employee demographics rather than theoretical industry averages.
PEO costs typically range from $1,000 to $1,500 per employee annually, but pricing varies widely based on three main models: per-employee-per-month fees, percentage of payroll (usually 2-12%), or custom bundled pricing. This guide breaks down how much a PEO costs by explaining each pricing structure, identifying the factors that drive your specific quote up or down, and providing a clear framework to evaluate whether the investment makes financial sense for your business size and needs.
Most business owners pay their PEO invoices without questioning whether the costs are fair, potentially overpaying by 15-30% monthly. This guide provides a systematic approach to PEO expense benchmarking, helping you understand what you’re actually paying, compare it against market reality for companies like yours, and negotiate from a position of knowledge rather than assumption.
This PEO cost forecasting guide helps businesses build accurate budget projections by accounting for workforce variables most companies overlook—like headcount changes, benefits enrollment patterns, and workers’ comp experience mods. Learn to create a working forecast model that prevents budget surprises and enables accurate provider comparisons beyond initial quotes.
