
Most advice on how to compare health plans starts in the wrong place. It tells employers to line up premiums, glance at deductibles, and pick the plan that looks cheapest on the rate sheet. That approach fails the minute a real employee uses the plan.
For companies with 10 to 2,000 employees inside a PEO or evaluating one, the right question isn’t “Which premium is lower?” It’s “What will this plan cost the company and the employee population over a full year?” Those are different calculations. A plan that looks efficient in a broker deck can turn into higher employee out-of-pocket exposure, harder recruiting conversations, and ugly renewal discussions.
Individual plan comparison guides dominate search results, and some are useful for consumer basics. A market-specific example is this overview on how to compare health insurance plans Spain, which shows how much context matters when evaluating networks, exclusions, and practical access to care. But employers buying through a PEO need a different model. They need population-level cost analysis, renewal-risk judgment, and operational discipline.
That starts with benchmarking current spend, contribution strategy, and plan structure against the market, not against a sales narrative. A proper employee benefits benchmarking process gives finance and HR a cleaner baseline before they compare any finalist options.
Table of Contents
- Stop Comparing Premiums Start Modeling Total Cost
- Define Objectives and Gather Essential Data
- Build a Total Cost of Ownership Model
- Analyze Coverage Details and Network Adequacy
- Score Trade-offs and Run Scenario Tests
- Communicate Your Recommendation and Ensure Compliance
Stop Comparing Premiums Start Modeling Total Cost
The cheapest rate sheet often produces the most expensive plan year.
That happens because premiums are only the visible cost. In a PEO arrangement, the actual decision sits underneath the invoice. Employer contributions, employee deductions, out-of-pocket exposure, network fit, service burden, and renewal risk all sit in the same economics. A finance team that compares only premiums is not controlling spend. It is choosing where the spend will show up.
That distinction matters more in a PEO than in a standard small-group comparison. Search results are full of guides built for individuals shopping on the exchange, or for families trying to compare health insurance plans Spain and other retail-style options. That is a different problem. A CFO reviewing PEO-sponsored coverage is buying for an employee population with uneven care needs, different salary bands, and varying tolerance for payroll deductions versus point-of-care costs.
Why premium-first decisions fail
A lower premium usually means one of three things. Higher employee cost sharing, narrower provider access, or more friction when people try to use care. Sometimes all three.
That trade can work for a stable, younger population with light utilization. It breaks quickly when the census includes families, specialty prescriptions, chronic conditions, or employees concentrated in markets where one carrier has weak provider coverage. The premium looks efficient in the renewal packet. The total cost shows up later through higher claims exposure for employees, more exceptions, more complaints, and more pressure on HR to clean up the fallout.
Inside a PEO, the comparison gets even messier. Health coverage is packaged with payroll, HRIS, compliance support, and account service. Those services have value, but they can also blur the underlying plan economics. I have seen finance teams accept a lower bundled increase without seeing that the medical option shifted costs onto the employees who use care most.
Practical rule: If the comparison can be settled from a single rate table, the analysis is too shallow for a population-level decision.
What total cost means in practice
For employer-sponsored coverage, total cost of ownership starts with four questions.
- What will the company fund? Premium contributions are only the first layer. Add any PEO administrative load, contribution strategy changes, and the effect of dependent tiers.
- What will employees pay in real use? Payroll deductions matter, but deductibles, coinsurance, copays, and out-of-network exposure shape whether the plan is affordable.
- Where will operations absorb friction? Billing disputes, enrollment corrections, ID card issues, provider disruption, and escalation volume all create labor cost inside HR and finance.
- What risk sits in year two? Some plans suppress current premiums by shifting utilization risk, creating a tougher renewal and a worse employee experience later.
This is why a population model beats a plan brochure. The useful question is not whether Plan A has a lower premium than Plan B. The useful question is how each option performs across your actual workforce once you price both employer spend and employee impact. If you need a reference point for what peer employers are funding and how contribution strategy compares by market, use current employee benefits benchmarking data before you accept the renewal narrative from the PEO or broker.
What a finance-grade comparison looks like
A sound comparison translates benefits language into operating and financial terms. It measures plan cost across the covered population, not just for a hypothetical employee. It also treats employee affordability as part of the company’s cost structure, because a plan that looks cheap on paper can create retention pressure, wage pressure, and avoidable service work.
The goal is simple. Build a model that shows where dollars move, who absorbs them, and what risks come with each option. That is how to compare health plans in a PEO setting.
Define Objectives and Gather Essential Data
Most renewal meetings start too late and with the wrong inputs. HR gets a renewal packet. Finance asks for the increase. The PEO says the market is tough. That sequence produces reactive decisions.
Before reviewing any plan summary, leadership needs a short list of decision rules. Otherwise, every trade-off gets argued in the abstract.
Set the decision rules before reviewing plans
Useful objectives are concrete. “Better benefits” isn’t a decision rule. “Reduce employer medical spend growth while preserving access for key hiring markets” is.
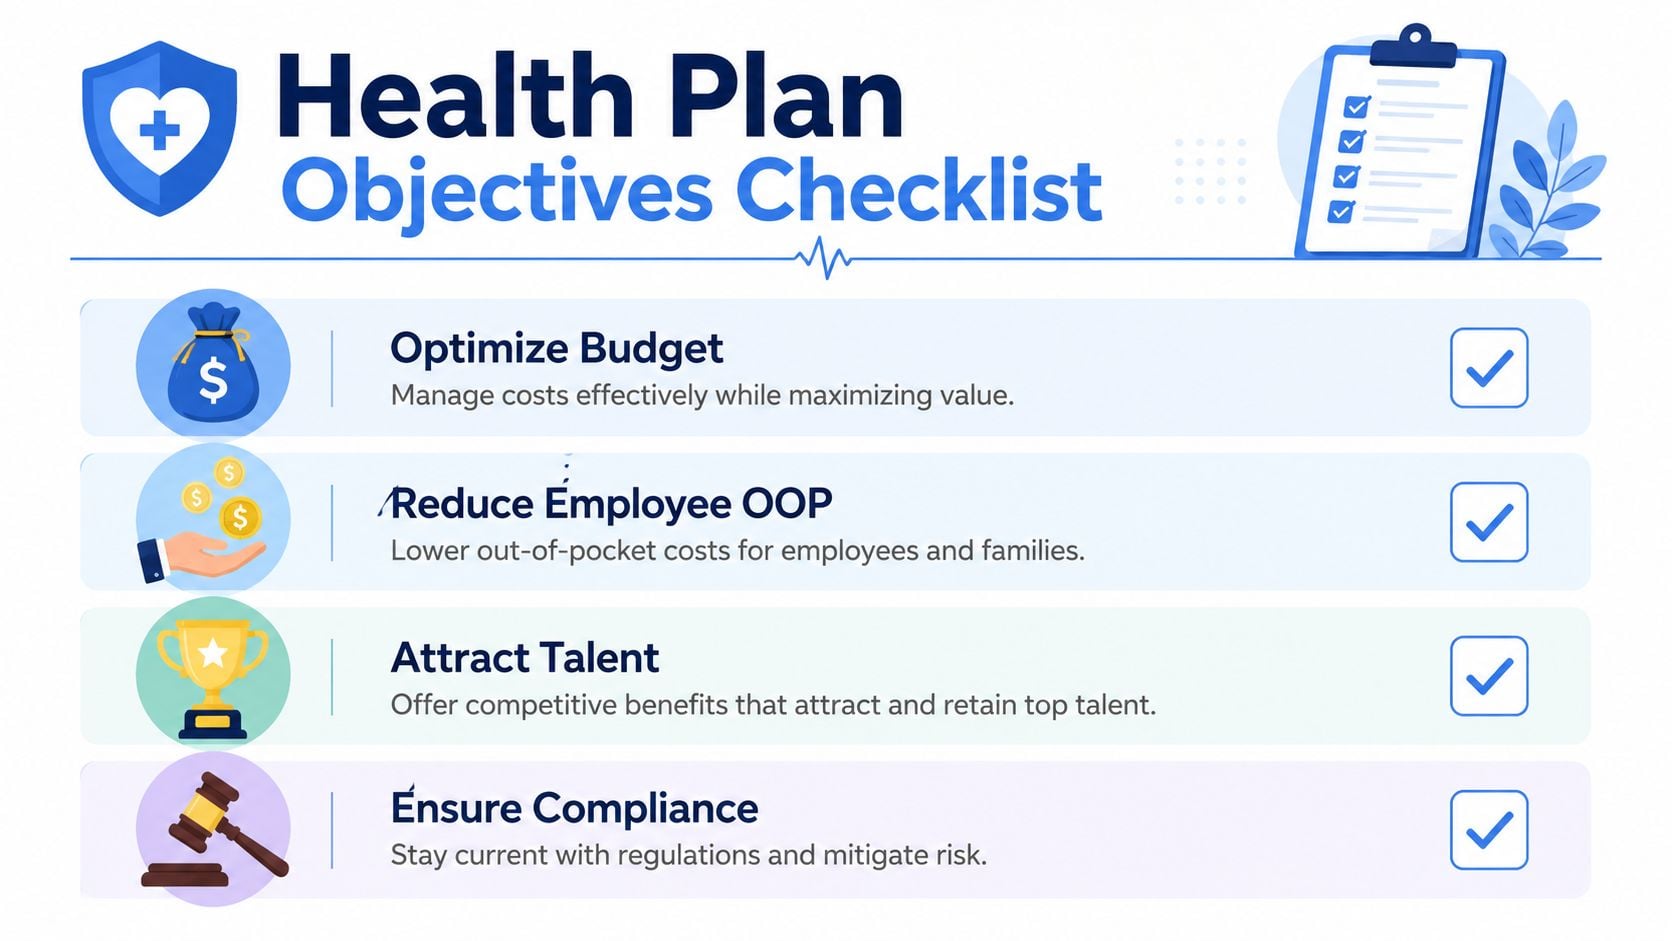
A practical objective set usually includes a mix of finance, workforce, and operating constraints:
- Budget control: define whether leadership is trying to cap employer spend, smooth renewals, or reallocate dollars from rich medical coverage into wages or other benefits.
- Employee affordability: decide whether the company is more concerned about paycheck deductions or point-of-care exposure.
- Talent strategy: identify whether benefits are a defensive retention tool, a recruiting differentiator, or a market-competitive baseline.
- Operational simplicity: determine how much complexity the HR team can absorb at open enrollment and during the plan year.
The best plan on paper still fails if employees can’t understand it or HR can’t administer it cleanly.
For PEO buyers, one issue deserves explicit attention. HR directors need to verify whether the PEO charges flat fees per employee or a percentage of monthly payroll, and they also need to confirm carrier access and plan customization because those details shape long-term affordability and fit (Deel on evaluating PEO health plans).
Request the data that actually changes the decision
Generic census files aren’t enough. A serious comparison needs enough detail to estimate how different plan designs will behave against the current population.
Request these items from the PEO, broker, or current administrator:
- Employee census with coverage elections: employee-only, employee plus spouse, employee plus children, and family enrollment patterns.
- Anonymized claims history: enough detail to separate low utilizers from heavier claimants without exposing personal information.
- Prescription utilization summary: especially for maintenance drugs, specialty drugs, and recurring therapies.
- Current contribution schedule: employer contribution by tier and any differences by class or location.
- Plan design summaries: deductibles, copays, coinsurance, out-of-pocket maximums, and network type.
- Service footprint details: where employees live and where the company is trying to hire.
- Administrative process map: who handles enrollments, life events, billing reconciliation, terminations, and employee questions.
If the PEO is slow to share this, that’s a signal in itself. A provider that can’t support disciplined evaluation before renewal usually won’t become more transparent after signature.
A strong review also includes the workflow burden around enrollment. The handoff between finance, HR, payroll, and the PEO matters, especially when life-event changes and carrier feeds get messy. A more structured PEO open enrollment administration process helps expose where hidden labor costs are sitting.
Build a Total Cost of Ownership Model
Premium tables are where weak evaluations go to hide.
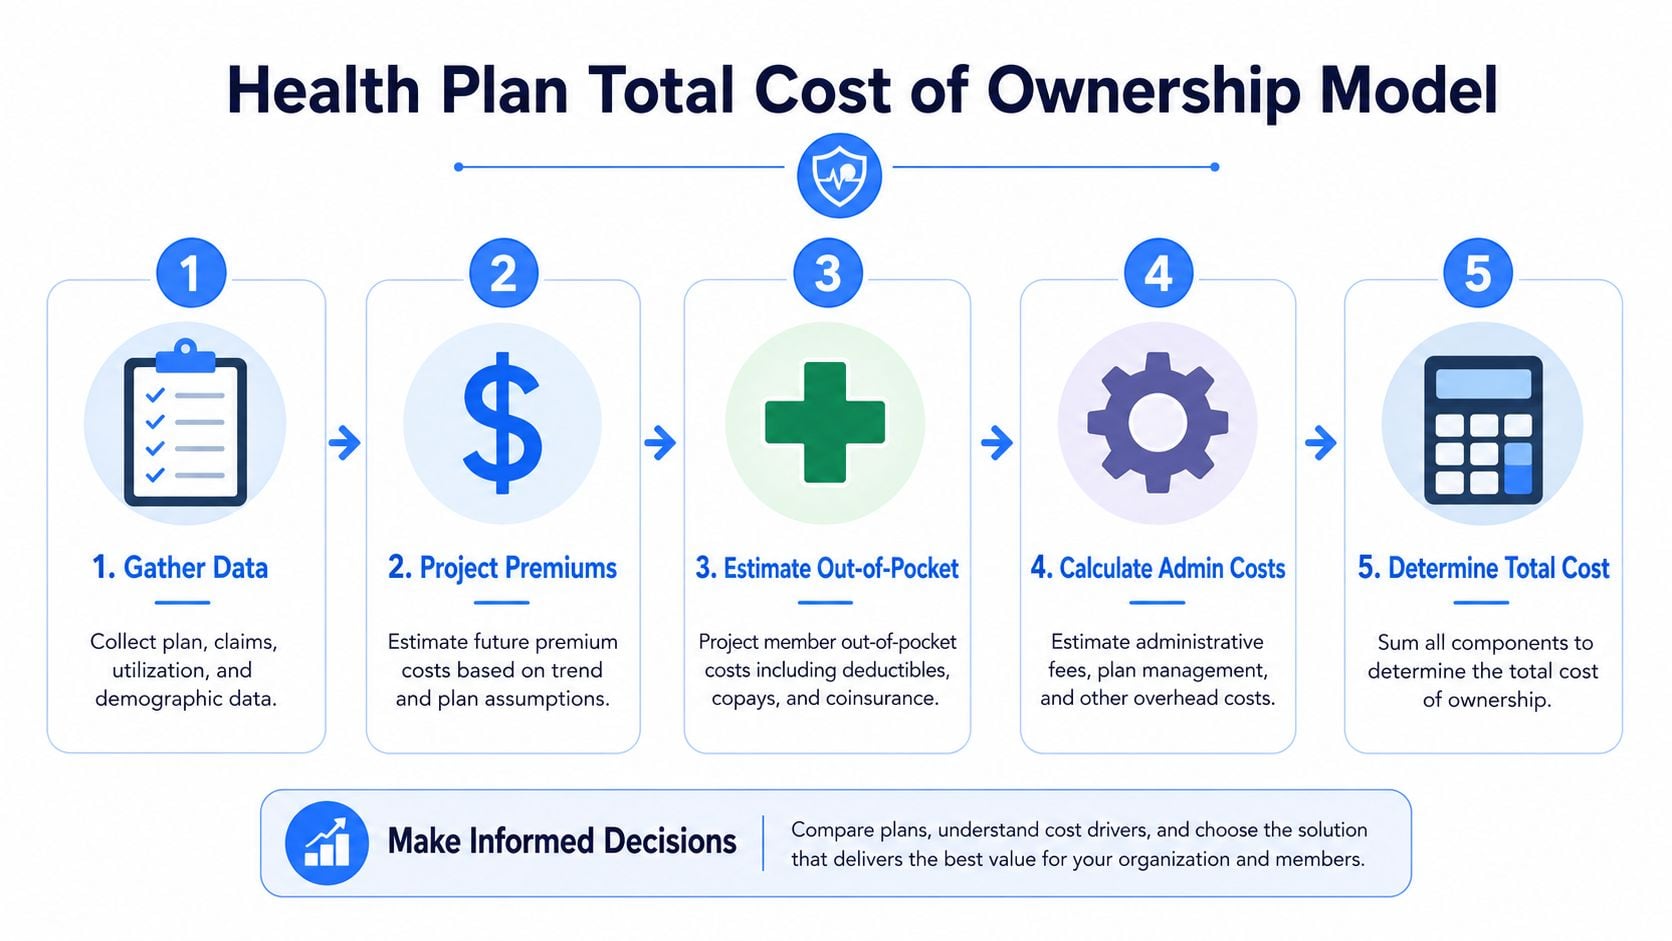
A CFO comparing PEO health options needs a model that prices the whole decision across the whole covered population. That means employer spend, employee payroll deductions, likely point-of-care exposure, PEO fees, internal labor, and disruption costs tied to changing plans or administrators. If one of those cost buckets is missing, the comparison is incomplete.
Use a five-line model before adding complexity
Start with one worksheet per finalist plan. Keep the first pass simple enough that finance, HR, and leadership can all audit the logic.
| Cost line | What to include |
|---|---|
| Employer premium cost | Employer share of monthly premiums across all enrolled employees |
| Employee premium cost | Employee payroll deductions by enrollment tier |
| Expected out-of-pocket spend | Deductibles, copays, coinsurance, and likely exposure up to the out-of-pocket maximum |
| Administrative cost | Internal HR time, billing reconciliation, open enrollment support, and vendor management |
| Transition cost | Disruption tied to carrier change, network change, or plan redesign |
That structure fixes a predictable mistake. Leadership approves the lowest employer premium, then gets hit later by employee complaints, higher turnover risk, pressure to increase contributions, and more exception handling inside HR. Those costs still land on the company. They just land in different budget lines.
Build the model in this order:
- Set enrollment assumptions by coverage tier.
- Apply employer and employee contribution schedules.
- Map historical utilization patterns to each plan design.
- Estimate out-of-pocket exposure by employee segment.
- Add administration, PEO fees, and transition burden.
The workflow matters as much as the math. In this operational review of an agency quoting process, explore this insurance quoting case. The lesson carries over. When pricing inputs sit across the broker, PEO, payroll system, and carrier PDFs, decisions slow down and error rates rise.
Model the population, not a hypothetical employee
Consumer guides usually compare plans one person at a time. That approach breaks inside a PEO.
An employer is buying for a mixed population with different coverage tiers, wage levels, care patterns, and provider dependency. A lower-premium plan can still raise total cost if it shifts too much expense to employees who use care regularly. A richer plan can also be the wrong answer if the company overpays to protect a population that rarely reaches the deductible.
At minimum, segment the covered group into three utilization bands:
- Low utilizers: preventive care, occasional urgent care, limited prescriptions
- Moderate utilizers: recurring office visits, therapy, routine imaging, maintenance drugs
- High utilizers: chronic conditions, specialist-heavy care, planned surgeries, pregnancy, specialty drugs
Then test each plan against those groups. The point is not to predict every claim. The point is to estimate how each design shifts cost between employer and employee across the population you have today.
Ask one blunt question. Which option produces the lowest combined employer and employee cost for this workforce mix, without creating service problems the company will end up paying for later?
Add the PEO-specific cost layers
PEO comparisons need more than the standard health-plan math.
First, price the PEO fee structure next to the health costs. A payroll-percentage model and a per-employee-per-month model behave very differently when wages rise, headcount changes, or hiring shifts toward higher-paid roles.
Second, price administrative drag as a real operating cost. Eligibility errors, invoice disputes, delayed ID cards, carrier escalations, COBRA coordination, and manual payroll corrections consume paid hours in HR, finance, and payroll. Many teams treat that as background noise because it does not show up on the plan summary. It still affects total cost.
Third, include transition friction if the recommendation requires a change. New enrollment files, employee education, payroll deduction updates, and short-term service disruption all have a measurable cost. Ignore that, and the first-year comparison gets distorted.
A detailed PEO total cost of ownership analysis puts those operating costs in the same model as premiums and claims exposure. That is the only way to compare PEO health options on terms that matter to finance.
A practical rule works well here. If a line item changes cash spend, employee behavior, or staff workload, include it. If it only appears in the sales deck, leave it out.
Analyze Coverage Details and Network Adequacy
A health plan can clear the spreadsheet and still fail the workforce.
That usually happens in three places: doctors, drugs, and geography. The plan summary says “in network.” Employees assume access is fine. Then a specialist is missing, a prescription moves to a different tier, or a key regional hospital system is excluded.

Compare networks by employee geography and provider dependency
Massachusetts guidance on comparing health insurance plans notes that 68% of consumers underestimate true annual healthcare spending when they ignore tiered networks, and that a tier 3 doctor can cost 20-40% more out of pocket than a tier 1 doctor even when both are in network (Massachusetts plan comparison guidance). For employers, that isn’t a consumer footnote. It’s a budgeting issue.
A solid review checks network adequacy in the places where the workforce lives and where recruiting matters. National logos don’t guarantee local depth.
Use a short stress test:
- Top employee locations: check primary care, core hospital systems, pediatric access, and specialist depth by metro.
- Critical provider dependency: identify employees or executives who rely on specific specialists, systems, or recurring therapies.
- Future hiring markets: verify that the plan works where the company wants to add people, not just where it operates today.
This matters even more for behavioral health. Mental health access can look acceptable at a high level and still break down in practice when local availability is thin. For a concrete example of why carrier-specific access checks matter, a localized directory-focused resource like telepsychiatry accepting Cigna Florida shows the kind of targeted provider verification employees end up doing when plan directories aren’t enough.
Review formulary and access friction before renewal
Drug coverage drives complaints faster than most other plan details because employees discover problems at the pharmacy counter, not during enrollment.
Review these items side by side for finalist plans:
| Area | What to check |
|---|---|
| Formulary status | Are common maintenance drugs preferred, non-preferred, or excluded |
| Prior authorization burden | Which recurring prescriptions or specialty therapies trigger extra review |
| Specialty pharmacy rules | Whether employees must use a designated channel and what that does to convenience |
| Step therapy rules | Whether employees must try lower-cost alternatives first |
| Mail-order requirements | Whether the plan nudges or requires different fulfillment for long-term medication |
A “good network” isn’t a slogan. It’s provider access in the ZIP codes that matter, with drug coverage employees can actually use.
The final check is operational. Ask how the PEO and carrier handle directory errors, transition-of-care requests, and urgent escalation. A plan with a slightly weaker rate can still be the better decision if the access problems are easier to fix and the service team resolves issues quickly.
A structured PEO medical plan comparison framework should force this review into the buying process instead of treating it as an afterthought after rates are negotiated.
Score Trade-offs and Run Scenario Tests
No finalist plan wins on every line. One may have better pricing, another a stronger network, another easier administration. The decision gets cleaner when leadership scores those trade-offs explicitly instead of debating them in a conference room.
BBSI notes that PEO-sponsored plans tend to have more structured pricing and reduced renewal volatility because risk is pooled across multiple client companies, while open-market small-group premiums can fluctuate more based on demographics, location, and group risk profile (BBSI on PEO vs open market health insurance). That matters because stability has value even when the current-year premium isn’t the absolute lowest option.
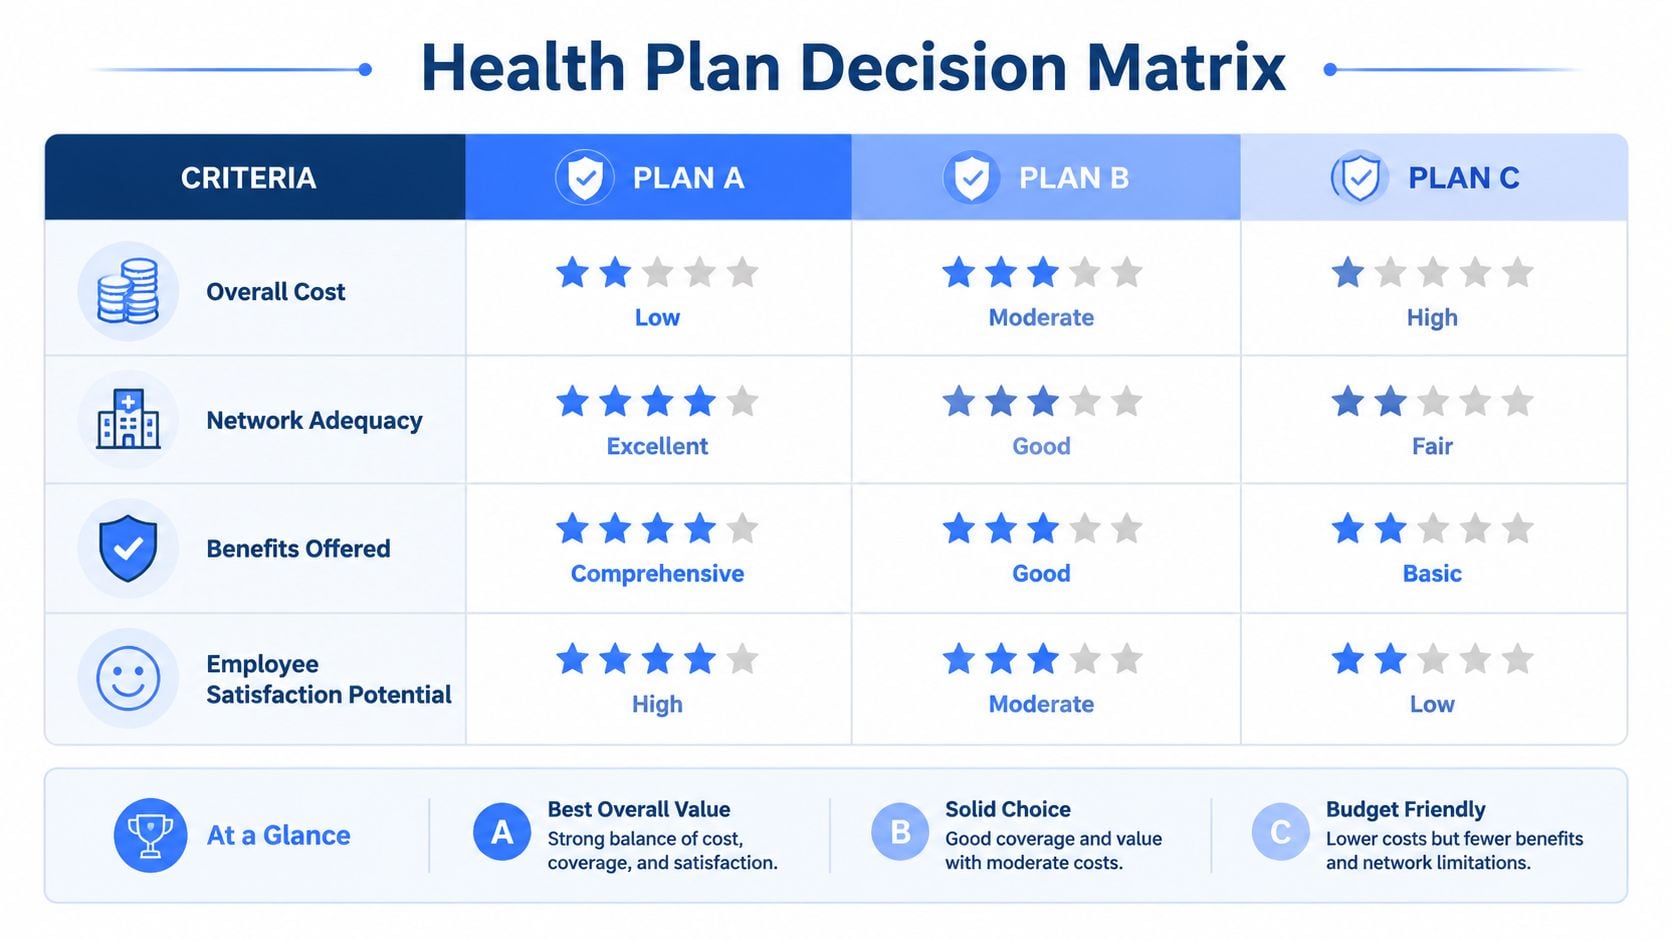
Build a weighted decision matrix
A practical scorecard uses a small number of criteria with clear weights. Keep it simple enough that leadership will trust it.
Typical categories include:
- Total employer cost: premium contribution, fees, and internal administration.
- Employee financial impact: payroll deductions and likely point-of-care exposure.
- Network adequacy: access in core geographies and for key provider relationships.
- Plan usability: ease of enrollment, member service quality, and claim issue handling.
- Renewal stability: how predictable the pricing model is likely to be.
One company may weight cost control most heavily. Another may prioritize recruiting in hard-to-fill markets and give network breadth more importance. The point isn’t to find the universal formula. It’s to make the trade-offs visible.
Run persona-based stress tests
The scorecard becomes much sharper when paired with a few employee personas. That forces leadership to look beyond averages.
Three personas usually surface most plan weaknesses:
- Single early-career employee with low expected utilization.
- Family enrollment with recurring pediatric and primary care use plus at least one ongoing prescription.
- High-value specialist user who needs dependable access to a specific health system or clinician set.
These tests often reveal that one plan is efficient for the majority but punishing for a smaller group the company can’t afford to disrupt. That’s where contribution strategy, HSA funding, or dual-option offerings become important.
A dedicated PEO scenario analysis financial model helps quantify that tension instead of leaving it to anecdote. The strongest recommendation usually isn’t the plan with the prettiest premium table. It’s the one with the best weighted score after persona testing, service review, and renewal-risk judgment.
Communicate Your Recommendation and Ensure Compliance
A strong analysis still fails if leadership gets a dense workbook and employees get a confusing benefits packet.
The executive recommendation should fit on one page. It needs a clear summary of the finalist options, the top cost differences, the key employee trade-offs, and the reason the chosen plan is the best fit for the company’s objectives. Anything longer becomes background material.
Turn the model into an executive summary
The summary should answer four questions in plain language:
- What changed: rates, plan design, network, or PEO fee structure.
- Why this option won: lower total cost, stronger stability, better access, or cleaner administration.
- Who is affected: which employee segments benefit and which may need support.
- What leadership should watch: renewal risk, contribution policy, and implementation timing.
The recommendation is stronger when it also addresses operational advantages. The U.S. Chamber notes that PEO health plans often cost less than open-market plans because PEOs use buying power and a unified platform for administration, and that this setup can save HR teams 10 to 20 hours per month on paperwork and enrollment tasks (U.S. Chamber on PEO health insurance). That operational gain belongs in the recommendation if the service model will deliver it.
Leadership doesn’t need every worksheet. It needs a defensible decision, the major trade-offs, and the implementation risks.
Make employee communication usable
Employee rollout should focus on decisions people need to make. Dense summaries of benefits don’t help much on their own.
A usable communication package includes:
- A one-page plan comparison: payroll deduction, deductible, out-of-pocket maximum, and major network notes.
- Persona examples: simple explanations for a single employee, a family, and a frequent-care user.
- A provider check process: where employees confirm doctors, hospitals, and prescriptions before enrollment.
- A support path: who handles enrollment questions, urgent access issues, and post-enrollment corrections.
Before finalizing, the company also needs a compliance pass. That includes affordability review, nondiscrimination considerations where applicable, contribution consistency, and documentation of the basis for the recommendation. A good process leaves a record that the decision wasn’t arbitrary. It was reasoned, documented, and aligned to business objectives.
PEO decisions get expensive when companies rely on sales decks, rate tables, or vague promises about better benefits. PEO Metrics helps employers compare PEOs side by side, benchmark pricing and benefits, review contract terms, and negotiate stronger deals so leadership can choose with clearer data and fewer surprises.