
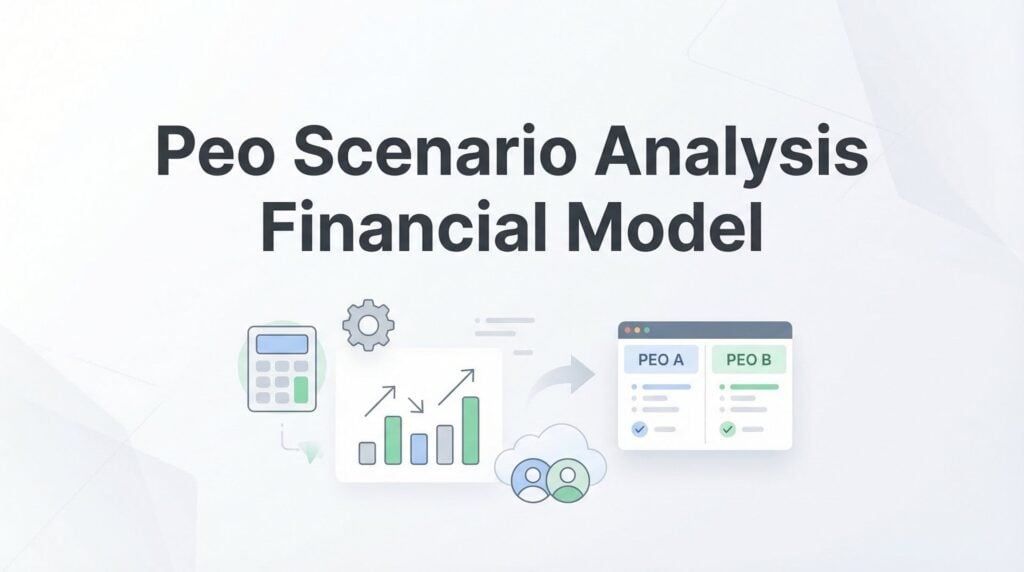
Most PEO cost comparisons stop at the quote. You get a per-employee-per-month fee, maybe a breakdown of admin costs and benefits markups, and that’s supposed to be enough to make a decision that could affect hundreds of thousands of dollars annually.
It’s not.
A proper scenario analysis financial model lets you stress-test PEO arrangements against real business variables—headcount changes, benefits utilization shifts, geographic expansion, and exit costs. This isn’t about building a fancy spreadsheet to impress your CFO. It’s about understanding what actually happens to your total cost of employment under different conditions before you sign a multi-year agreement.
This guide walks through building a financial model that captures the variables that matter, runs scenarios that reflect your actual business trajectory, and produces outputs that support defensible decisions. We’re assuming you already understand basic PEO economics—if you need a refresher on how PEO pricing works or what goes into ROI calculations, start with our foundational guides first.
What follows is the mechanics of building a model that answers the question every business owner actually has: What does this PEO arrangement really cost us if things don’t go exactly as planned?
Step 1: Map Your Cost Categories and Variable Drivers
Before you build anything, you need to know what you’re modeling. Start by identifying the five core cost buckets that define PEO economics: admin fees, benefits premiums, workers’ comp, payroll taxes, and hidden costs.
Admin fees are usually quoted as a flat per-employee-per-month rate, but they’re rarely that simple. Some PEOs charge tiered rates based on headcount bands. Others add per-payroll processing fees or charge extra for employees in certain states. Document exactly how your admin fees are structured and what triggers rate changes.
Benefits premiums are where most of the cost variability lives. PEOs pool you with other companies, which can work in your favor or against you depending on your demographics and utilization patterns. You need actual data here—not averages. Pull your current benefits participation rates, plan selection patterns, age distribution, and family status breakdown. If your workforce skews younger with low family coverage, you’ll model differently than a company with older employees and high family plan enrollment.
Workers’ comp costs depend on your industry classification codes, payroll volume, and experience modification rate. PEOs often promise better rates through their pooled buying power, but your actual cost depends on claims history. If you’ve had a clean record, the PEO’s pooled rate might not beat what you’re getting now. If you’ve had claims, the pooling might shield you from rate increases you’d face on your own. Understanding PEO workers compensation management is essential for accurate modeling.
Payroll taxes are mostly fixed as a percentage of wages, but PEOs sometimes charge administrative markups on top of the actual tax liability. Make sure you know whether you’re paying the statutory rate or the statutory rate plus a processing fee.
Hidden costs are what kill most models. Technology platform fees. Per-transaction charges for things like adding new employees or processing terminations. COBRA administration fees. Year-end reconciliation adjustments when actual benefits costs exceed projections. Renewal escalators that kick in after year one. Document every fee in the PEO’s contract, not just the ones in the marketing materials.
Now identify your variable drivers—the inputs that make costs change. Headcount is obvious, but don’t stop there. Average salary affects payroll taxes and workers’ comp. Benefits participation rates affect premiums. Geographic distribution affects workers’ comp classification and state-specific fees. Claims history affects renewal rates.
Pull your actual current-state data for each category. What are you paying now for each cost bucket? If you’re running HR in-house, include the fully loaded cost of your HR staff, benefits broker fees, HRIS subscription costs, and workers’ comp premiums. If you’re already with a PEO, break down last year’s actual costs by category, not what was quoted.
This baseline becomes your comparison anchor. Every scenario you model will be measured against what you’re actually spending today, adjusted for realistic inflation.
Step 2: Structure Your Model Architecture
A good financial model separates inputs, calculations, and outputs into distinct layers. This isn’t about making it look pretty. It’s about making it usable when you need to change assumptions without breaking formulas.
Start with an inputs tab where all your assumptions live. Headcount by month. Average salary. Benefits participation rates. Workers’ comp mod rate. Admin fee structure. Benefits renewal inflation assumptions. Every number that might change goes here, clearly labeled. Use color coding if it helps—green for assumptions you control, yellow for assumptions that depend on external factors, red for contractual terms you can’t change once you sign.
Your calculations tab is where the formulas live, and nobody should ever need to touch it once it’s built. This tab pulls from inputs and applies the cost formulas you’ve documented. Keep the logic transparent—if someone else needs to audit your model, they should be able to follow how you got from inputs to results without reverse-engineering complex nested formulas.
Outputs are your summary views. Total cost by scenario. Cost per employee comparisons. Year-over-year changes. Breakeven analysis. This is what you’ll actually look at when making decisions, so design it for clarity. A three-year cost projection broken down by quarter is more useful than a monthly view that runs off the screen.
Build your baseline scenario first. This reflects your current state with realistic cost inflation applied. If your benefits costs have been increasing at eight percent annually, use eight percent. If your headcount has grown fifteen percent year-over-year, model that trajectory. The baseline should represent what happens if you keep doing what you’re doing now.
Set up scenario toggles that let you swap assumptions without rebuilding anything. Use data validation dropdowns or simple scenario flags that change which input set the calculations reference. You want to be able to switch from “base case” to “high growth” to “adverse renewal” with a single click and see all your outputs update automatically. This approach aligns with building a PEO savings projection model that adapts to changing conditions.
Include time dimension carefully. Monthly granularity matters in year one because PEO implementations have transition costs and timing issues. You might go live in March, which means nine months of PEO costs plus three months of your old arrangement. But monthly detail for three years creates spreadsheet bloat without adding insight. Model monthly for year one, then switch to quarterly for years two and three.
Why does time matter? Because PEO costs compound differently than in-house costs. Your benefits broker might charge a flat annual fee. A PEO’s admin fees increase every year, and those increases stack. A three percent increase in year two applies to the already-increased year one rate. Over three years, that compounding matters.
Step 3: Build Your PEO Cost Formulas
Now you’re ready to model the actual costs. Start with admin fees, which seem straightforward but rarely are. Most PEOs quote a per-employee-per-month rate, but read the contract for escalation clauses. Many build in annual increases of three to five percent. Some tie increases to benefits renewal outcomes, which means your admin fees can jump if the benefits pool has a bad year.
Model admin fees as base rate times headcount times escalation factor. If you’re starting at $150 PEPM with a three percent annual increase, year two is $154.50 PEPM, year three is $159.14. Multiply by average headcount for each period. Don’t forget to account for mid-year rate changes if your contract includes them.
Benefits costs require actual demographic modeling. Don’t use the PEO’s projected average cost per employee—that number is meaningless for your specific population. Build a benefits cost model that reflects your actual employee distribution across age bands, family status, and plan selection. Understanding how PEO benefits administration works will help you identify where costs actually accumulate.
If forty percent of your employees are under thirty and mostly choose employee-only coverage, your costs will skew lower than the pool average. If you have a lot of employees in their fifties with family coverage, you’ll skew higher. Model each demographic segment separately, apply the PEO’s age-banded rates, and aggregate up.
Include realistic benefits inflation. PEOs often project five to seven percent annual increases, but actual renewal rates can swing from zero to twenty percent depending on claims experience. Model a range. Your base case might use seven percent. Your adverse scenario might use fifteen percent for year two to see what happens if the pool has a bad claims year.
Workers’ comp gets modeled as a function of payroll and mod rate. Take your total payroll by classification code, multiply by the PEO’s quoted rate per hundred dollars of payroll, then apply your experience mod. If your mod is 0.85, you’re paying eighty-five percent of the standard rate. If it’s 1.20, you’re paying twenty percent above standard.
Here’s what most models miss: your mod can change. If you have a significant claim while with the PEO, your mod increases, and that increase affects your costs for the next three years. Model sensitivity around mod rate changes. What happens to your total cost if your mod goes from 0.90 to 1.10 because of a single large claim?
Add the costs that don’t show up in the initial quote. Implementation fees are often charged upfront but should be amortized over your expected contract term. If you pay $15,000 to implement and you’re modeling a three-year relationship, that’s $5,000 per year in effective cost.
Per-payroll processing charges add up. If the PEO charges $3 per payroll run per employee and you run biweekly payroll, that’s $78 per employee per year. Across a hundred employees, it’s $7,800 annually—enough to matter.
COBRA administration fees often get overlooked until you have your first termed employee who elects continuation coverage. Some PEOs charge $50-100 per month per COBRA participant for administration. If you have normal turnover, you’ll have COBRA participants. Model it.
Year-end reconciliation adjustments happen when actual benefits costs exceed the PEO’s projections. Many contracts include true-up provisions where you pay the difference. If the PEO projected $800 per employee per month in benefits costs but actual costs were $850, you owe the $50 difference times twelve months times average headcount. On a hundred employees, that’s $60,000 you didn’t budget for.
Step 4: Define Your Comparison Scenarios
You’ve built the model architecture and formulas. Now define the scenarios that actually matter for your decision.
Scenario A is status quo. What do you pay if you keep your current arrangement—whether that’s in-house HR, a different PEO, or a mix of vendors—with realistic cost inflation? Don’t lowball the inflation assumptions to make the PEO look better. If your benefits broker’s fees have increased five percent annually, use five percent. If your workers’ comp premiums have been climbing, model that trend.
Include the costs of maintaining current capabilities. If you’re in-house, that means HR staff salaries, benefits broker fees, HRIS subscription costs, workers’ comp premiums, and the time your finance team spends on payroll and compliance. Fully loaded costs, not just the obvious line items. This comparison is central to any PEO ROI and cost-benefit analysis.
Scenario B is the PEO base case. This uses the PEO’s projected costs with their stated assumptions about headcount, benefits inflation, and claims experience. It’s the rosy scenario where everything goes according to plan. You’re modeling this not because you believe it, but because you need a reference point that matches the PEO’s own projections.
Scenario C is growth acceleration. What happens if you hire thirty percent faster than planned? PEO economics often improve with scale because admin fees are per-employee but many operational costs are semi-fixed. But benefits costs and workers’ comp scale linearly with headcount, and rapid hiring can shift your demographic mix in ways that affect costs.
Model the timing carefully. If you add thirty employees in Q2 instead of spreading them across the year, your Q2 costs spike. If those new hires are younger and choose less expensive benefits plans, your per-employee costs might actually drop even as total costs rise. Companies experiencing this trajectory should explore PEO strategies for rapid growth.
Scenario D is an adverse benefits year. Model a fifteen to twenty percent benefits renewal increase and see how PEO pooling affects you differently than standalone coverage. This is where pooling can work in your favor—if you’re in a large pool, your company’s bad claims year gets absorbed. But it can also work against you if the pool overall has a bad year and you’re stuck with the increase even though your employees were healthy.
Compare this to what would happen with standalone coverage. If you had your own benefits plan and experienced the same claims, what would your renewal look like? Sometimes the PEO’s pooled increase is better than what you’d face alone. Sometimes it’s worse because you’re subsidizing other companies’ claims.
Scenario E is the exit scenario. Model what it costs to leave the PEO at year two or year three. This includes benefits transition costs—you’ll need to set up new coverage, which means broker fees, potential gap coverage, and the risk of higher rates as a small group coming out of a pool. Include COBRA exposure for employees who were on the PEO’s plan and need continuation coverage during the transition. Our guide on how to leave your PEO covers these transition costs in detail.
Add the operational costs of rebuilding HR capabilities if you’re moving back in-house. You’ll need to hire or reallocate staff, implement new systems, and handle the compliance work the PEO was doing. Don’t model exit costs as zero just because there’s no explicit termination fee in the contract.
Step 5: Run Sensitivity Analysis on Key Variables
You’ve defined scenarios. Now test which variables actually drive your decision. Most PEO cost models are sensitive to three factors: headcount trajectory, benefits renewal rates, and workers’ comp experience. But your business might be different.
Build a sensitivity table for each major variable. For headcount, model a range from twenty percent below your base case to fifty percent above. Calculate total three-year cost at each level. You’re looking for inflection points—where does the PEO become more expensive than your current arrangement? Where does it become dramatically cheaper?
Many businesses find that PEOs are cost-effective in a specific headcount range. Below thirty employees, you’re paying for capabilities you don’t fully use. Above two hundred employees, you can often build in-house capabilities for less than the PEO charges. But that range varies by industry, benefits utilization, and risk profile.
For benefits renewal rates, model a range from zero percent (flat renewal) to twenty percent (adverse claims year). Plot total cost against renewal rate for both the PEO scenario and your current arrangement. Find the crossover point. At what renewal rate does the PEO’s pooling advantage disappear?
If you’d face a fifteen percent increase on your own but the PEO’s pool only increases eight percent, pooling saves you money. But if your claims were clean and you’d only see a five percent increase on your own while the pool increases twelve percent because other companies had bad years, pooling costs you money. This dynamic is worth understanding when evaluating PEO benefits administration outsourcing.
For workers’ comp, model mod rate changes from 0.70 (excellent experience) to 1.30 (poor experience). Calculate the cost impact. If you’re currently at 0.85 and have a large claim that pushes you to 1.15, what does that do to your three-year total cost? Does the PEO’s pooled rate insulate you from that increase, or are you still exposed?
Document which scenarios favor the PEO and which favor alternatives. You’re building a decision framework, not trying to prove the PEO is right or wrong. The model should tell you: under these conditions, the PEO saves money. Under these other conditions, it doesn’t.
That clarity is worth more than a definitive answer, because business conditions change. What’s true today might not be true in eighteen months when you’re evaluating renewal.
Step 6: Validate and Stress-Test Your Model
You’ve built a model that produces numbers. Now make sure those numbers mean something. Start with back-testing against historical data. If you’d been with this PEO last year, what would you have actually paid based on your real headcount changes, actual benefits claims, and actual workers’ comp experience?
Run your model using last year’s actual inputs and compare the output to what you actually spent. If the model says you would have spent $1.2 million but you actually spent $1.4 million, you’ve missed something. Either your cost categories are incomplete or your formulas don’t capture how costs actually behave.
Get PEO-specific validation inputs. Don’t rely on the rosy projections in the sales deck. Ask for actual renewal history. What have admin fees increased by for existing clients over the past three years? What’s the average benefits renewal rate for their pool? What’s the range—best year and worst year?
Ask about workers’ comp mod rate adjustments. How often do clients see their mods increase after claims? What’s the typical magnitude? If the PEO says mods rarely change, that’s a red flag—mods change based on claims experience, and every pool has claims. Understanding PEO strategies for high insurance mod rates helps you evaluate these claims critically.
Run a worst-case combination scenario. High growth plus adverse benefits renewal plus a significant workers’ comp claim. What’s your maximum exposure? This isn’t about predicting disaster. It’s about understanding your downside risk before you commit.
If the worst-case scenario is ten percent above your current costs, that might be acceptable risk. If it’s forty percent above, you need to think hard about whether you’re comfortable with that exposure or whether you need contractual protections like rate caps or early termination rights. Knowing how to negotiate your PEO contract becomes critical when seeking these protections.
Verify your model produces outputs that match the PEO’s own projections when using their assumptions. Plug in their headcount growth rate, their benefits inflation estimate, their projected mod rate. Your model’s output should match their cost projection within a few percentage points.
If it doesn’t match, you’ve either misunderstood their fee structure or they’re not being transparent about how costs are calculated. Either way, you need to resolve the discrepancy before you trust any of your scenario outputs.
Get a second set of eyes on the model. Have your CFO or a finance team member review the logic. Fresh eyes catch errors you’ve looked at so many times you don’t see them anymore. They’ll also ask questions about assumptions you’ve taken for granted, which often leads to better modeling.
Making Decisions With Your Model
A financial model is only as useful as the decisions it enables. Once you’ve built and validated your scenario analysis, you should be able to answer three questions with confidence.
First: Under what conditions does this PEO arrangement save us money? Be specific. Is it only if we grow headcount by at least twenty percent annually? Is it only if benefits renewals stay below ten percent? Is it dependent on avoiding large workers’ comp claims? Know the conditions that make the economics work.
Second: What’s our realistic downside exposure if things don’t go as planned? You’ve modeled the worst-case combination. You know the number. Can you absorb that cost if it happens? Do you have budget flexibility or contractual protections that limit your risk?
Third: At what point should we reconsider this arrangement? Set trigger points now. If actual costs in year one exceed projections by more than fifteen percent, we revisit. If headcount growth slows below a certain threshold, we model alternatives. If benefits renewals hit a certain level, we evaluate whether pooling is still working in our favor.
Keep your model updated as you get actual data. The assumptions you made during evaluation will drift from reality. Your headcount might grow faster or slower than projected. Your benefits claims might be better or worse than expected. Update your model quarterly with actual results and re-run your scenarios.
This isn’t busywork. It’s how you catch problems early. If you’re six months into a PEO relationship and your actual costs are tracking fifteen percent above projections, you need to know that now, not at renewal when you’ve already committed to another year.
If you’re comparing multiple PEO providers, run each through the same model with their specific fee structures and terms. Use identical assumptions for headcount, benefits utilization, and claims experience. The only variables that should change are the PEO’s rates and contract terms.
The provider that looks cheapest on a quote often doesn’t look cheapest across a range of realistic scenarios. One PEO might have lower admin fees but higher benefits markups. Another might have better workers’ comp rates but steeper annual escalators. Your model shows you which provider performs better under the conditions most likely to reflect your actual experience.
Before you sign that PEO renewal, make sure you’re not leaving money on the table. Many businesses unknowingly overpay because of bundled fees, hidden administrative markups, and contracts designed to limit flexibility. We give you a clear, side-by-side breakdown of pricing, services, and contract terms—so you can see exactly what you’re paying for and choose the option that truly fits your business. Don’t auto-renew. Make an informed, confident decision.