
When you’re running payroll for 100+ employees across multiple states, the difference between PEO providers isn’t theoretical—it’s tens of thousands of dollars annually. Enterprise workforce savings calculators help you model actual cost impacts before signing a multi-year agreement.
But most calculators are marketing tools designed to make their own PEO look good.
This guide covers the calculators worth your time—tools that show real numbers, account for enterprise complexity, and help you compare apples to apples across providers.
1. PEO Metrics Comparison Calculator
Best for: Comparing multiple PEO providers side-by-side with enterprise-specific cost modeling
PEO Metrics is an independent comparison tool that models savings across multiple PEO providers simultaneously, accounting for the variables that actually matter at enterprise scale.
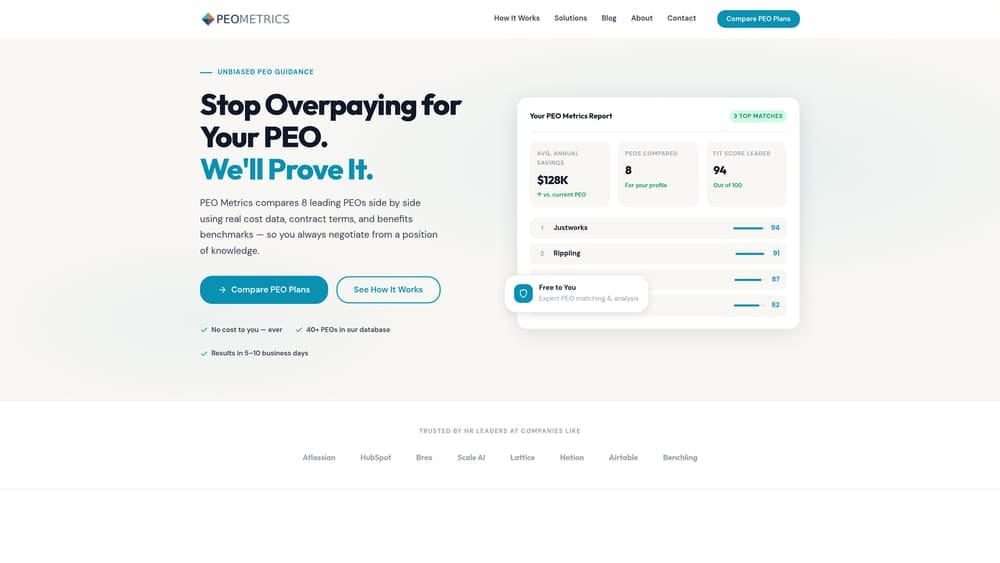
Where This Tool Shines
Unlike provider-specific calculators that only show you their own numbers, this tool lets you model costs across different PEOs in one place. That matters when you’re trying to understand whether the $15 PEPM difference between two providers is real or just accounting for different service levels.
The multi-state complexity modeling is particularly useful. If you’ve got employees in six states with different workers’ comp rates and unemployment insurance requirements, you need a calculator that accounts for that variability—not one that gives you a national average.
Key Features
Side-by-side provider comparisons: Model multiple PEOs simultaneously to see cost differences in real time.
Multi-state payroll modeling: Accounts for state-specific tax complexity and compliance requirements that affect enterprise pricing.
Headcount tier adjustments: Pricing changes at 100, 250, and 500 employee thresholds—this tool models those breaks accurately.
Admin fee transparency: Separates administrative fees from benefits costs so you know exactly what you’re paying for service versus coverage.
Unbiased analysis: Not tied to any single PEO provider, which means projections aren’t optimized to make one option look better.
Best For
Enterprise HR teams evaluating multiple PEO providers or comparing renewal terms against market alternatives. Especially valuable if you’re operating in multiple states or crossing headcount thresholds where pricing tiers change.
Pricing
Free comparison tool with consultation services available for companies needing deeper analysis or negotiation support.
2. NAPEO ROI Calculator
Best for: Establishing baseline savings expectations using industry-wide benchmark data
NAPEO is the industry association for PEO providers, and their ROI calculator uses aggregated data from certified PEOs to establish conservative savings estimates.
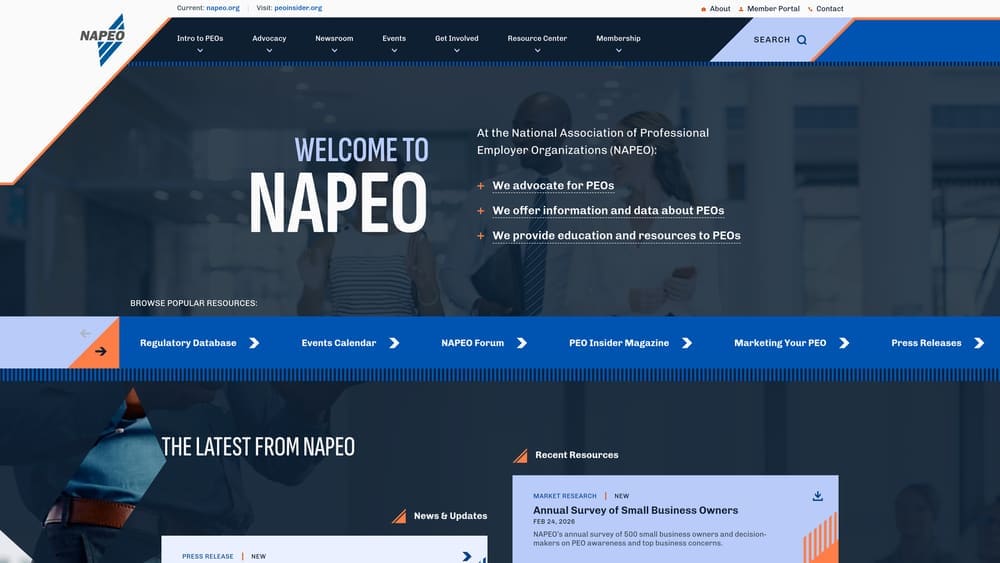
Where This Tool Shines
This calculator is useful as a starting point because it’s not trying to sell you on a specific provider. The estimates tend to be conservative, which is helpful when you’re building a business case internally and don’t want to overpromise.
The benchmark data comes from actual PEO client experiences across industries, so you’re seeing what companies similar to yours have achieved rather than theoretical projections.
Key Features
Industry-wide benchmarks: Data aggregated from certified PEOs across the association membership.
Conservative estimates: Projections tend toward the lower end of savings ranges, which helps with realistic budgeting.
No provider bias: Association tool means no single PEO is being promoted over others.
Initial research tool: Good for understanding whether PEO economics make sense before diving into provider-specific analysis.
Best For
Finance teams building initial business cases or HR leaders who need industry benchmarks to present to executive leadership before engaging specific providers.
Pricing
Free tool available on the NAPEO website.
3. ADP TotalSource Enterprise Calculator
Best for: Companies already using ADP payroll evaluating their full-service PEO offering
ADP TotalSource offers an enterprise-focused calculator that integrates with existing ADP data for companies considering their PEO transition.
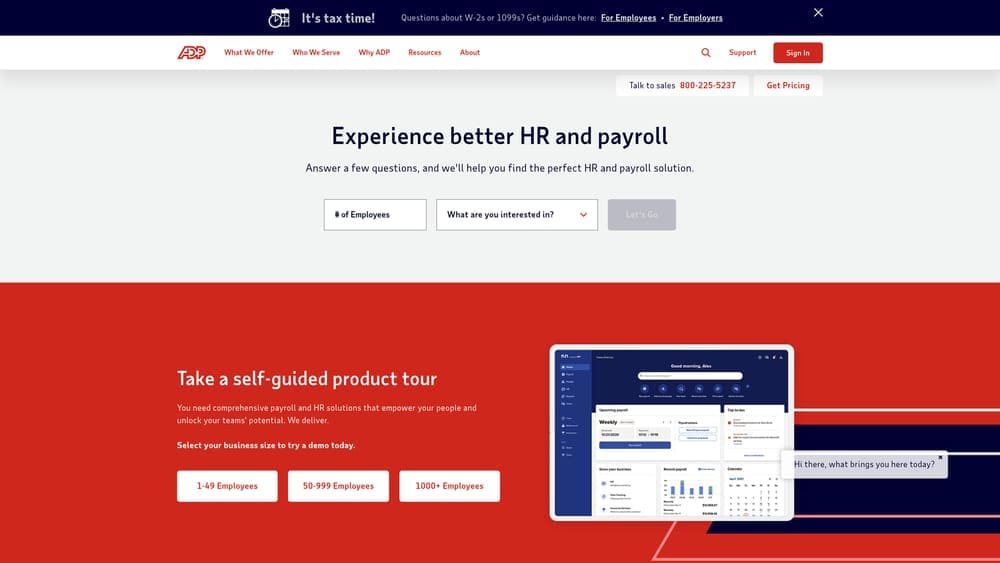
Where This Tool Shines
If you’re already running ADP for payroll, this calculator can pull your actual data rather than requiring manual input. That means more accurate projections based on your real employee demographics, current benefits costs, and payroll complexity.
The compliance cost avoidance modeling is more sophisticated than most provider calculators. It accounts for the specific regulations in your operating states and estimates penalty avoidance based on your current compliance posture.
Key Features
ADP data integration: Pulls from existing payroll systems for accurate baseline modeling without manual data entry.
Enterprise-scale focus: Built for companies with 150+ employees where complexity justifies full-service PEO models.
Compliance cost projections: Models penalty avoidance and risk reduction based on multi-state operations.
Workers’ comp analysis: Estimates savings from pooled risk and improved experience mod rates.
Best For
Mid-size to large companies already in the ADP ecosystem evaluating whether to upgrade from payroll-only to full PEO services.
Pricing
Free calculator available, but detailed quotes require contact with their enterprise sales team.
4. Insperity Workforce Optimization Calculator
Best for: Benefits-heavy companies focused on health insurance and workers’ comp savings
Insperity provides a calculator with particularly strong modeling for benefits costs and workers’ compensation savings at enterprise scale.

Where This Tool Shines
The health insurance cost modeling goes deeper than most calculators. It accounts for plan design differences, employee contribution strategies, and the pooling advantages that matter when you’re bringing 100+ employees into a larger risk pool.
The workers’ comp experience mod rate analysis is also more detailed. If you’re in a high-risk industry with elevated mod rates, this calculator helps you understand the potential savings from joining a PEO’s pooled program.
Key Features
Health insurance modeling: Detailed analysis of plan costs, employee contributions, and pooling advantages.
Workers’ comp analysis: Experience mod rate projections and savings from pooled risk programs.
Benefits admin time savings: Estimates hours saved on enrollment, carrier management, and employee support.
Compliance cost estimates: Models cost avoidance from improved HR compliance and risk management.
Best For
Companies with high benefits costs or elevated workers’ comp rates looking to quantify savings from better risk pooling and carrier negotiation.
Pricing
Free calculator available, with custom enterprise quotes based on headcount and service needs.
5. Paychex PEO Savings Estimator
Best for: Growing companies transitioning from mid-market to enterprise scale
Paychex offers a calculator focused on companies scaling from 50 to 200+ employees and facing increasing compliance complexity.

Where This Tool Shines
This calculator is particularly useful if you’re crossing the thresholds where compliance gets expensive. It models the cost of adding HR staff, implementing compliance systems, and managing multi-state payroll as you grow.
The compliance penalty avoidance estimates are based on common violations for growing companies—things like misclassified employees, late tax filings, and benefits administration errors that become more likely as headcount increases.
Key Features
Scaling cost projections: Models costs as you grow from 50 to 200+ employees across multiple complexity thresholds.
Compliance penalty estimates: Projects cost avoidance from common violations during growth phases.
Payroll processing time: Calculates hours saved on payroll administration as complexity increases.
Benefits cost comparison: Shows how pooled benefits costs compare to direct market rates at different headcount levels.
Best For
Fast-growing companies that need to understand when PEO economics make sense as they scale and add operational complexity.
Pricing
Free estimator with custom pricing quotes based on current and projected headcount.
6. TriNet Enterprise Cost Analyzer
Best for: Tech, professional services, and financial services companies seeking industry-specific benchmarks
TriNet provides an industry-specific calculator with vertical benchmarks for companies in their core service sectors.

Where This Tool Shines
The industry-specific benchmarks are more accurate than generic calculators because they account for the benefits expectations and compensation structures common in your sector. Tech companies have different benefits profiles than manufacturing companies—this tool reflects that.
The risk management cost modeling is particularly relevant for professional services firms dealing with E&O insurance, client contract requirements, and regulatory complexity specific to their industries.
Key Features
Industry-specific benchmarks: Cost projections tailored to tech, professional services, and financial services sectors.
Vertical benefits analysis: Models benefits packages that match industry norms and talent expectations.
Risk management modeling: Estimates costs for industry-specific insurance and compliance requirements.
Multi-state compliance: Projects costs for companies operating across state lines with varying regulations.
Best For
Companies in TriNet’s core verticals that want benchmarks based on similar businesses rather than cross-industry averages.
Pricing
Free analyzer available, with enterprise pricing requiring consultation based on industry and headcount.
7. Justworks Total Cost Calculator
Best for: Companies wanting transparent per-employee pricing without sales calls
Justworks offers a straightforward calculator with clear per-employee-per-month pricing tiers and no hidden complexity.

Where This Tool Shines
The transparency is the point here. You can see exactly what you’ll pay per employee without talking to sales or waiting for a custom quote. That’s valuable when you’re doing initial research or comparing against providers with more complex pricing structures.
The tier-based pricing is simple—Basic versus Plus—with clear feature differences. No need to decode what “enhanced service level” means or whether you’re getting the same benefits package as the quote you saw online.
Key Features
Transparent PEPM pricing: Clear per-employee-per-month rates displayed upfront without sales calls.
Simple tier structure: Two clear service levels with defined feature sets and pricing.
No sales requirement: Full pricing available online without contact information or consultation.
Clear benefits add-ons: Additional benefits costs shown separately so you know exactly what drives total cost.
Best For
Companies that prefer transparent pricing and want to understand costs before engaging in sales conversations.
Pricing
Basic plan at $59 per employee per month; Plus plan at $109 per employee per month. Benefits costs additional based on selections.
Making the Right Choice
If you’re just starting your research, begin with the NAPEO ROI Calculator to establish baseline expectations. It’ll tell you whether PEO economics make sense for your situation before you invest time in provider-specific analysis.
For serious multi-provider comparison, PEO Metrics gives you the most comprehensive view. The side-by-side modeling is particularly valuable when you’re trying to understand whether pricing differences reflect actual service variations or just different fee structures.
If you’re already in the ADP ecosystem, their TotalSource calculator will give you the most accurate projections because it pulls your real data. Same logic applies to TriNet if you’re in one of their core verticals—industry-specific benchmarks beat generic projections.
Here’s what these calculators won’t tell you: whether the PEO’s service quality matches their pricing, how responsive they are when compliance issues arise, and whether their contract terms give you flexibility if your business changes. Calculators show you the math. They don’t show you the relationship.
At some point, you need actual quotes and reference calls. But starting with the right calculator means you’re asking better questions when you get to that stage.
Before you sign that PEO renewal, make sure you’re not leaving money on the table. Many businesses unknowingly overpay because of bundled fees, hidden administrative markups, and contracts designed to limit flexibility. We give you a clear, side-by-side breakdown of pricing, services, and contract terms—so you can see exactly what you’re paying for and choose the option that truly fits your business. Start a conversation