

Most companies pay between $40 and $160 per employee per month or 2% to 12% of payroll in PEO administrative fees. True all-in cost commonly reaches $1,000 to $1,500 per employee per month once benefits and pass-through costs are included.
That range makes the popular advice, “Just compare the PEPM fee,” dangerously incomplete. A proposal that looks inexpensive on page one can become costly after medical benefits, workers' compensation, payroll taxes, renewal increases, implementation charges, and termination terms enter the calculation.
A PEO decision should therefore be treated as a multi-year total-cost-of-ownership analysis. The relevant question isn't what the PEO charges today. It's what the relationship will cost through renewal, how much of that amount represents genuine administration, and what the company could owe when the contract ends.
Table of Contents
- What PEO Cost Actually Means
- How PEO Pricing Models Work
- What Drives Your Quoted Rate
- PEO Cost Examples at Three Company Sizes
- Admin Fees Versus Pass-Through Costs
- Renewal and Exit Economics Most Buyers Miss
- How to Negotiate a Lower Total PEO Cost
What PEO Cost Actually Means
A PEO quote is not a single expense. It is a stack of charges that can behave differently over the life of the relationship. Review the administrative fee separately from health and welfare benefits, workers' compensation, unemployment insurance, payroll taxes, retirement administration, and event-based fees.
The administrative layer typically pays for payroll processing, HR technology, benefits administration, compliance support, and the PEO's role in the co-employment structure. Pass-through costs follow a different logic. They can include medical, dental, vision, life, and disability premiums, workers' compensation premiums, federal and state unemployment taxes, FICA, and retirement-related charges. COBRA administration, wage garnishments, off-cycle payroll runs, and special implementation work can add fees outside the quoted rate.
The three comparison traps
Three formats make proposals look easier to compare than they are:
- Blended PEPM: One figure combines administration, insurance, taxes, and other items, so the PEO's actual margin remains difficult to identify.
- Percentage of payroll: The fee rises with salaries, even when the PEO's workload stays the same.
- “At-cost” benefits: This may mean the benefits are passed through, but it does not show which carriers were selected, how plan changes are priced, or whether administration charges sit on top.
Use the published benchmark as a screening tool, not as a forecast. The cited pricing range covers both PEPM and payroll-percentage structures, while mid-market proposals may cluster near a narrower PEPM band (PEO pricing benchmarks). A 50-person company at $100 PEPM would incur roughly $60,000 annually in administrative fees before pass-through costs. That figure describes only the service layer, not the company's total PEO cost.
A finance team reviewing an acquisition separates purchase price from integration costs, working capital, and liabilities. Apply the same discipline here. Resources that help buyers evaluate deal costs before buying offer a useful framework for testing a PEO proposal, even though the transaction itself differs.
Start by understanding what a professional employer organization does. Then model administrative margin, pass-through expenses, renewal exposure, and exit liability across the contract term. That total-cost-of-ownership view exposes costs a sales deck can hide, including benefits changes, renewal increases, and termination obligations.
How PEO Pricing Models Work
Most PEO proposals use one of two structures. The first charges a flat per-employee-per-month fee, often called PEPM. The second applies a percentage to gross payroll. Both can be reasonable. The wrong choice can transfer more money to the PEO as the workforce changes.
Flat PEPM pricing
Consider a company with 25 employees, average annual pay of $60,000, and a flat administrative fee of $90 PEPM. The annual administrative cost is:
25 employees × $90 × 12 months = $27,000
That amount stays stable if salaries rise, assuming headcount and the contractual fee remain unchanged. PEPM pricing tends to favor companies with higher-paid employees, slower headcount growth, or predictable staffing.
Percentage-of-payroll pricing
A company with $1.5 million in annual payroll paying a 3% administrative fee would spend:
$1.5 million × 3% = $45,000
The fee automatically grows with payroll. A business with a large salary base can outgrow this structure even if its employee count remains steady. Percentage pricing may fit lower-wage, seasonal, or high-turnover workforces where payroll is smaller relative to headcount. A separate example shows the scale clearly: at $500,000 in monthly payroll and a 4% fee, administrative charges reach $20,000 per month (percentage-of-payroll pricing example).
| Company Profile | PEPM @ $90 | Payroll % @ 3% | Annual Difference |
|---|---|---|---|
| 25 employees, $1.5 million annual payroll | $27,000 | $45,000 | $18,000 higher under payroll percentage |
Hybrid structures add a base PEPM fee plus a smaller payroll percentage, commonly for benefits administration or specialized services. These quotes require extra care because the buyer may assume the base fee represents the entire administrative charge.
The contract should also identify minimum monthly fees, per-employee floors, and implementation charges. A provider may describe implementation as waived while amortizing it across the first 12 months. Buyers should request the invoice treatment, not rely on the sales label. A detailed explanation of PEO pricing and cost structure can help finance teams map every component before comparing providers.
What Drives Your Quoted Rate
A PEO underwriter prices more than payroll administration. The quote reflects the risk attached to the workforce, the complexity of the states involved, and the cost of the benefits package the PEO expects to support.
Industry classification is a major influence. A desk-based consultancy generally presents a different workers' compensation profile from a construction, warehouse, or manufacturing operation. The difference isn't caused by the payroll software. It comes from job duties, workplace exposure, claims potential, and the insurance structure attached to those roles.

The inputs behind the number
A buyer can often predict the direction of a quote by organizing the following information before the sales process:
- Industry and job classifications: Underwriters need accurate descriptions of physical work, driving, field activity, equipment use, and office roles.
- Geographic footprint: State unemployment schedules, paid-leave requirements, mandated benefits, and local compliance obligations affect administration and insurance.
- Claims history: Medical and workers' compensation claims can influence the offered structure, especially for smaller groups.
- Headcount stability: Frequent hiring, layoffs, seasonal staffing, and turnover make the PEO's expected workload less predictable.
- Average tenure: A short-tenure workforce may create more onboarding, benefits, and termination activity.
- Pay distribution: A high average wage can make percentage pricing more expensive, while a large low-wage workforce can make PEPM pricing more burdensome.
- Benefit elections: Spousal coverage, dependent enrollment, plan richness, and employer contribution policy all affect pass-through cost.
- Retirement commitments: A 401(k) match and the desired level of administration can change the proposal even when the basic payroll scope is identical.
A proposal that appears to have a high administrative rate may be absorbing difficult workers' compensation exposure or a complicated multi-state structure. Conversely, a low headline fee may be paired with benefit terms that shift more cost to the employer at renewal.
Practical rule: Give every bidder the same census, claims information, job classifications, and benefit assumptions. Otherwise, the comparison measures different risk models instead of different prices.
Companies reviewing claims-based and pooled insurance structures should understand the distinction between experience rating and community rating. The rate is only meaningful when the underwriting assumptions behind it are visible.
PEO Cost Examples at Three Company Sizes
A PEO quote is not a budget until you model it across the full contract term. The table below isolates administrative pricing, while benefits and other pass-through charges remain separate. It uses the same fee assumptions for each company profile, so the comparison shows how headcount, wages, and pricing structure affect the administrative portion of total cost.
For these examples, the PEPM option is $90 per employee per month, and the payroll option is 3% of annual payroll. The modeled administrative range runs from $40 to $160 PEPM. Treat those figures as comparison points, not as a complete three-year cost forecast. Renewal increases, benefit changes, and exit charges can materially change the final amount.
| Company Profile | Admin Fee (PEPM) | Admin Fee (% Payroll) | Annual Admin Cost (Low) | Annual Admin Cost (High) | Effective PEPM All-In |
|---|---|---|---|---|---|
| 12-person professional services firm, $75,000 average wages | $12,960 | $27,000 | $5,760 at $40 PEPM | $23,040 at $160 PEPM | Requires benefits pass-through |
| 60-person light-manufacturing operation, $52,000 average wages | $64,800 | $93,600 | $28,800 at $40 PEPM | $115,200 at $160 PEPM | Requires benefits pass-through |
| 250-person multi-state retail group, $38,000 average wages | $270,000 | $285,000 | $120,000 at $40 PEPM | $480,000 at $160 PEPM | Requires benefits pass-through |
Reading the examples correctly
The professional services firm has annual payroll of $900,000. At 3%, its administrative cost is $27,000. The PEPM option is lower in this illustration because the firm has relatively high average wages. That advantage disappears if benefits, renewal changes, or termination terms add cost elsewhere.
The manufacturing operation has annual payroll of $3.12 million. Its percentage option reaches $93,600, compared with $64,800 under the PEPM model. Workers' compensation exposure and claims assumptions can still change the proposal, so the table cannot determine the final all-in price.
The retail group has annual payroll of $9.5 million. Its two administrative options are relatively close, but the multi-state footprint, headcount, turnover, and benefit elections can determine which structure costs less over several years.
Add benefits to every row rather than treating the administrative fee as the PEO's total price. For a broader view of staffing scale, review PEO considerations for 100 employees, including fee structure and service capacity. Then ask the provider to show year-two and year-three costs, renewal assumptions, pass-through changes, and the amount payable when the relationship ends.
Admin Fees Versus Pass-Through Costs
A low PEO administrative fee can still produce a costly contract. Buyers who compare only that line miss benefits, payroll taxes, workers' compensation, renewal treatment, and exit charges that accumulate over the relationship.
The administrative fee generally covers the PEO's service margin: HR technology, payroll processing, compliance administration, benefits support, employee service, and its role as a co-employer. Pass-through costs usually go to insurers, government agencies, retirement providers, or other vendors. A credible proposal separates both categories instead of presenting one blended total.
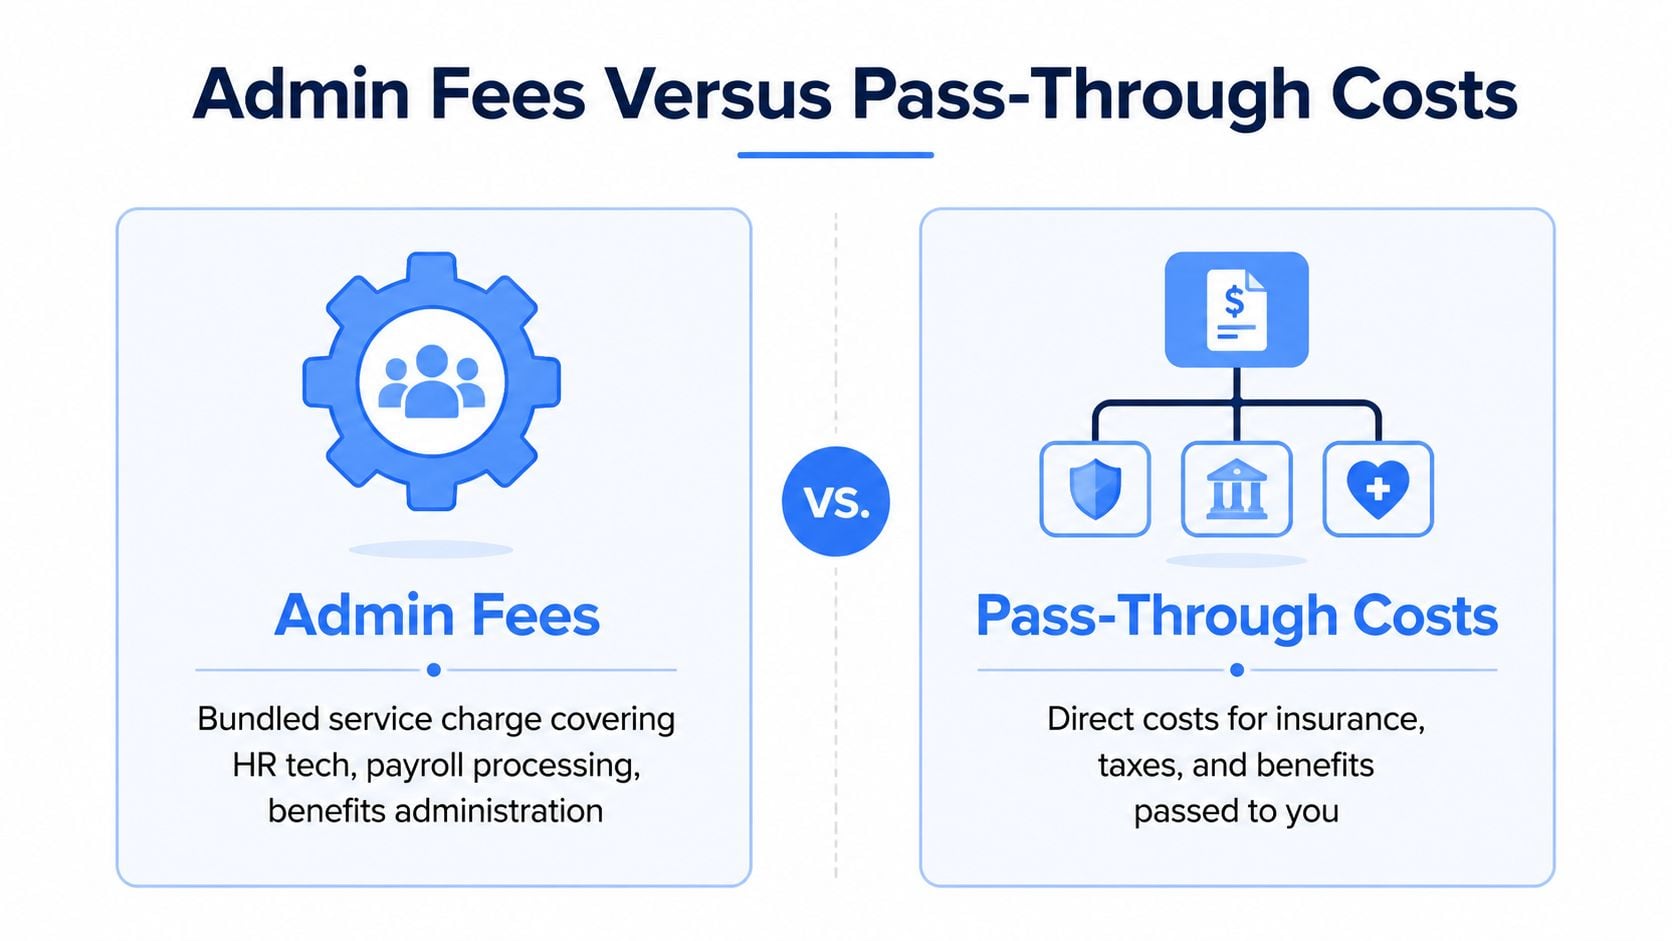
What belongs in each column
| Administrative Fees | Pass-Through Costs |
|---|---|
| HR technology | Medical insurance |
| Payroll processing | Dental and vision insurance |
| Benefits administration | Workers' compensation |
| Compliance support | Federal and state unemployment taxes |
| Employee service | FICA and related payroll taxes |
| Co-employment administration | Life, disability, 401(k), and EAP costs |
A quoted $90 PEPM does not necessarily mean the PEO keeps $90. If $45 PEPM covers the provider's actual margin after benefits-related services are separated, the remaining amount still needs to be traced to specific costs. The example is not a universal margin benchmark. It shows why blended pricing makes provider comparisons unreliable.
Administrative fees may fall between $40 and $90 PEPM, while benefits pass-through may add $400 to $1,200 PEPM, depending on plan design and workforce risk. Those figures should appear in separate columns with documented assumptions for employee contributions, dependents, plan selection, and renewal treatment.
A low admin fee does not create a low-cost PEO when benefits, workers' compensation allocation, or renewal terms work against the buyer.
Review this small business benefits guide 2026 to distinguish core benefits from optional coverage and identify items that affect employee contributions. Then require the proposal to state whether each benefit is employer-paid, employee-paid, or passed through under the carrier arrangement selected by the PEO. Model those charges across the full contract term, not just the first invoice.
Renewal and Exit Economics Most Buyers Miss
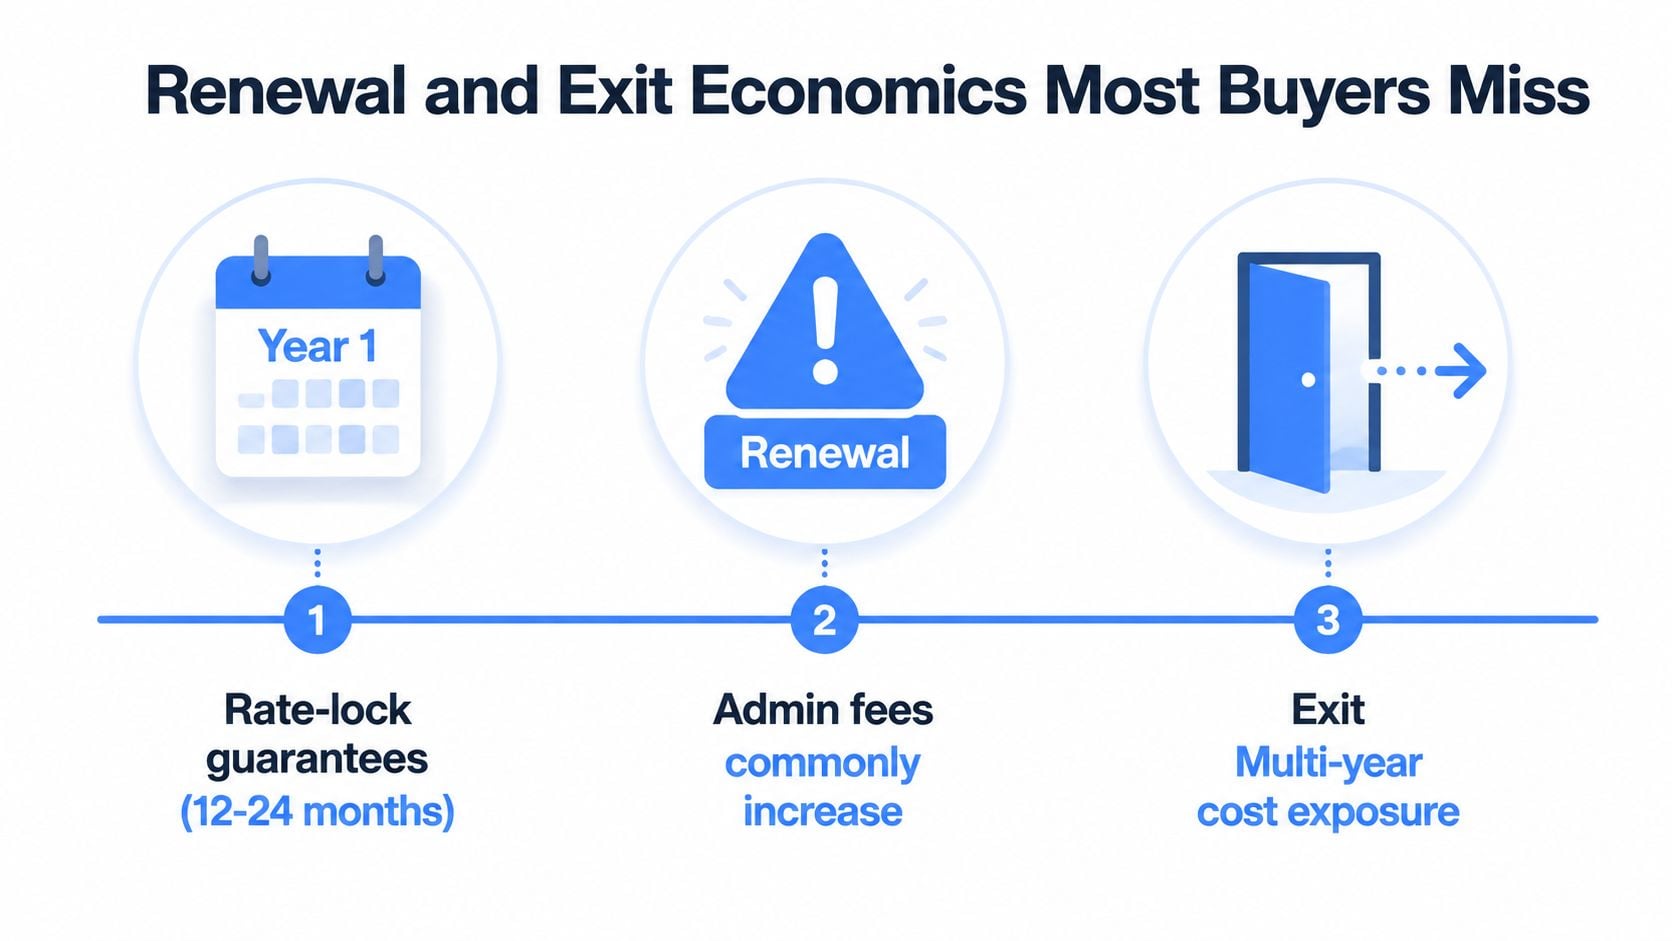
The first-year quote can hide the contract's real cost. Review what happens after the rate lock, how benefits are repriced, and what termination requires before approving the proposal.
Industry cost guidance identifies 8% to 18% renewal increases as common, particularly when health-plan renewals pass through to the client (PEO renewal and contract costs). Termination charges may range from a flat fee to several months of administrative fees, or 1% to 3% of annual payroll in higher-risk structures. Put both renewal and exit terms into the financial model.
A three-year model
Assume a company starts with 100 employees and an administrative fee of $100 PEPM. That produces $120,000 in year-one administrative cost before pass-through items. If the agreement locks the rate for the first 12 to 24 months, year two depends on the renewal language and the date the lock expires.
A buyer modeling a 3% annual administrative increase after the lock would project:
- Year 1: $120,000
- Year 2: $120,000 if the rate remains locked
- Year 3: $123,600 after the modeled increase
The three-year administrative total reaches $363,600. That figure excludes benefits, workers' compensation, taxes, implementation charges, and exit costs. Finance should therefore evaluate the relationship against a multi-year schedule, not the launch quote.
Benefits can create a larger increase than the administrative escalator. A claims year that produces a 15% rise in medical cost may shift that renewal expense to the client through a pass-through structure rather than the PEO's profit and loss statement (PEO renewal and contract costs). Model administrative fees and benefit charges separately, then combine them in the total-cost view.
Exit liabilities need their own schedule
The contract review should address:
- Rate-lock duration: Confirm whether the lock covers administration only or also protects benefit-related charges.
- Minimum commitments: Identify employee floors, minimum monthly charges, and buyout calculations.
- Workers' compensation tail: Residual claims liability can continue for two to four years after termination.
- Retirement exposure: Ask counsel whether an ERISA withdrawal liability issue could arise under the specific plan structure.
- Termination charges: Require a formula, not a general reference to “standard fees.”
Before giving notice, document payroll records, claims files, benefit elections, tax accounts, and employee communications. A structured PEO exit strategy helps management treat termination as a planned transition instead of an invoice discovered after the decision. Review the exit schedule with counsel and finance, then include every identified obligation in the three-year cost model.
How to Negotiate a Lower Total PEO Cost
Negotiation should start with the contract terms that can affect several renewal cycles, not with small service concessions. The strongest buyers arrive with a standardized census, competing proposals, claims information, and a three-year cost model.
Rank the negotiating levers
| Lever | Typical Annual Savings | Effort | Renewal Risk |
|---|---|---|---|
| Multi-year administrative rate cap | Must be modeled from quoted fees | Medium | High if the cap excludes benefits |
| Workers' compensation credit | Must be calculated from the proposal | Medium | Medium if claims assumptions change |
| Implementation fee waiver | Equals the documented implementation charge | Low | Low |
| Payroll tax, W-2, and 1099 inclusions | Depends on excluded event fees | Low | Medium |
| HR technology credit | Equals the negotiated platform credit | Low | Medium |
| Benefit contribution parity | Depends on employer contribution policy | High | High at renewal |
| Service-level guarantees | Depends on service failures and credits | Medium | Medium |
The first demand should be a multi-year rate cap tied to a defined index or formula rather than a discretionary increase. The buyer should also seek implementation fee waivers, workers' compensation credits, and clear inclusion of W-2, 1099, tax filing, and ordinary payroll support.
The second tier includes HR technology credits, guaranteed response standards, and benefit contribution benchmarks. These may not reduce the headline fee, but they can prevent the company from paying separately for services the sales process implied were included.
Quarter-end timing can create an advantage when a provider wants to close an active opportunity, but timing alone won't fix a weak comparison. Every bidder should receive the same census, state list, job classifications, claims history, payroll totals, benefit elections, and retirement assumptions.
Negotiation warning: Reduced onboarding hours and capped HR support can look like savings until the company needs help during an acquisition, termination event, audit, or benefits renewal.
The final redline should identify every excluded fee, renewal formula, carrier repricing rule, minimum commitment, termination charge, and liability allocation. A lower first-year rate is useful only when it survives that review.
PEO Metrics offers an independent side-by-side analysis of PEO pricing, benefits, service terms, and contract risks, including projected total cost and renewal or exit issues. HR and finance teams can visit PEO Metrics to compare providers and identify negotiation points before signing or renewing.
