Breakdowns of PEO pricing models, fee structures, hidden costs, and long-term financial impact. Includes comparisons between percentage-of-payroll and per-employee pricing models.
A PEO cost benefit analysis framework goes far beyond comparing admin fees to payroll processing costs—it requires evaluating the complete financial picture on both sides of the equation. This practical guide helps business owners identify hidden costs in their current setup, understand the true total cost of a PEO arrangement, and accurately assess where financial value is created or lost before signing a contract.
A PEO total cost of ownership analysis reveals that the admin fee is just one layer of what businesses actually pay — workers’ comp bundling, benefits spread, payroll tax float, and hidden exit costs significantly impact the true price of a PEO relationship. This guide breaks down every cost bucket, what drives variability in each, and how to pressure-test vendor proposals before signing.

The PEO hybrid HR cost model creates a complex pricing structure that most businesses never fully map out, leaving hidden costs on both sides of the service split. This guide breaks down what companies actually pay when dividing HR responsibilities between a PEO and internal staff, exposing where bundled margins and loaded in-house costs quietly accumulate.
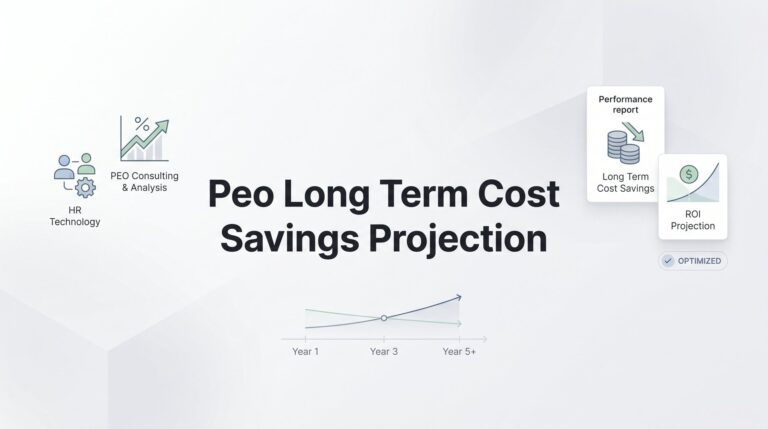
A PEO long-term cost savings projection built on validated assumptions—not just first-year quotes—reveals whether a PEO arrangement genuinely delivers value over three to five years by accounting for insurance renewal trends, administrative labor displacement, compliance risk reduction, and hidden fees that quietly erode savings. This guide provides a realistic framework for businesses to evaluate true PEO costs before and after signing.
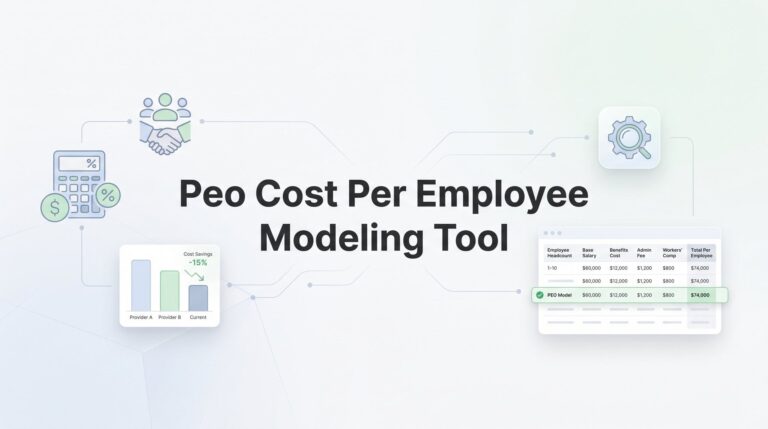
Building an accurate PEO cost-per-employee modeling tool before signing a contract helps business owners avoid invoice surprises by mapping every fee layer — from admin charges and workers’ comp markups to benefits pass-throughs and payroll tax handling. This guide walks through creating a practical spreadsheet framework that reveals the true all-in cost of PEO services, giving HR leaders and business owners a clearer basis for comparing providers and negotiating renewals.
A PEO net present value calculator helps businesses move beyond simple monthly fee comparisons by collapsing multi-year costs—including rate escalations, workers’ comp premiums, and benefit renewals—into a single comparable number in today’s dollars. This guide walks through building a working NPV model so you can accurately evaluate PEO providers over a three-to-five year horizon and identify which option is truly cheaper long-term.
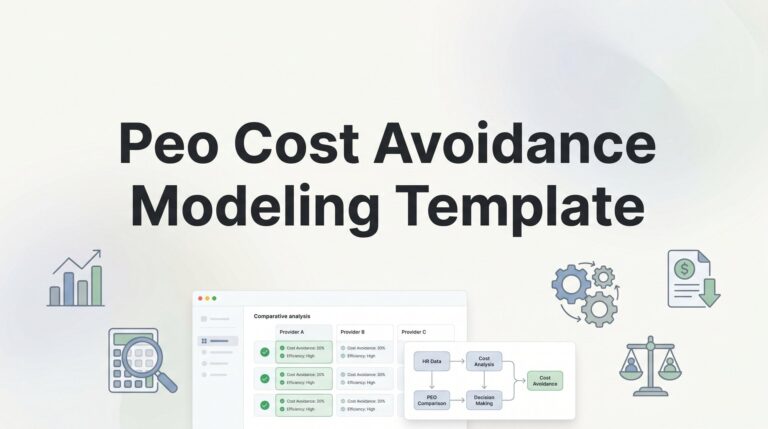
A PEO cost avoidance modeling template helps businesses move beyond simple price comparisons to quantify the hidden costs of not using a PEO—including compliance penalties, HR time losses, and workers’ comp exposure. This guide walks through building a rigorous, unbiased model from scratch that captures real financial risk over a 12-to-36-month horizon.
A PEO cost transparency financial review helps business owners uncover hidden fees buried in admin charges, insurance markups, and workers’ comp spreads that often go unnoticed in standard monthly invoices. This guide provides the documents, questions, and structured framework needed to understand exactly what you’re paying for and whether your PEO is delivering fair market value.
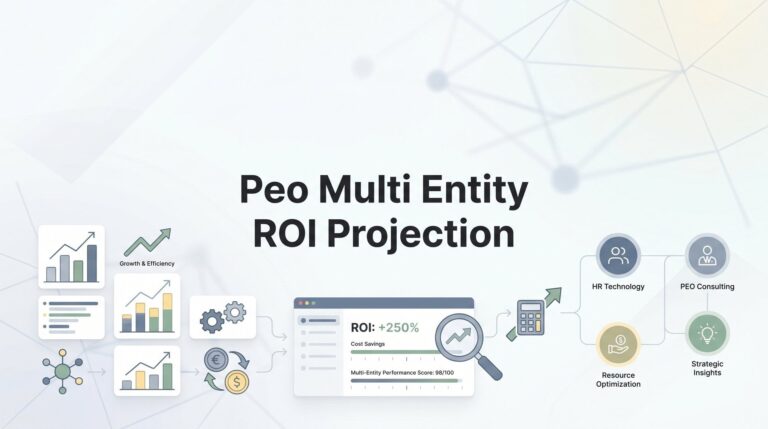
Building an accurate PEO multi-entity ROI projection requires analyzing each business unit separately, since generic provider estimates fail to account for varying headcounts, state compliance obligations, workers’ comp profiles, and pricing tiers across entities. This guide walks multi-entity operators through a structured, entity-by-entity framework to identify where a PEO genuinely delivers savings, where it doesn’t, and where hidden costs can quietly erode returns.

Enterprise finance teams often underestimate PEO cost complexity by treating bundled fees as a single budget line item, leading to costly variances at scale. This guide explains how to build a PEO enterprise budgeting calculator using your actual cost data—modeling layered expenses like admin fees, workers’ comp, benefits pass-throughs, and state-specific taxes across large, multi-state workforces for more accurate financial forecasting.
