
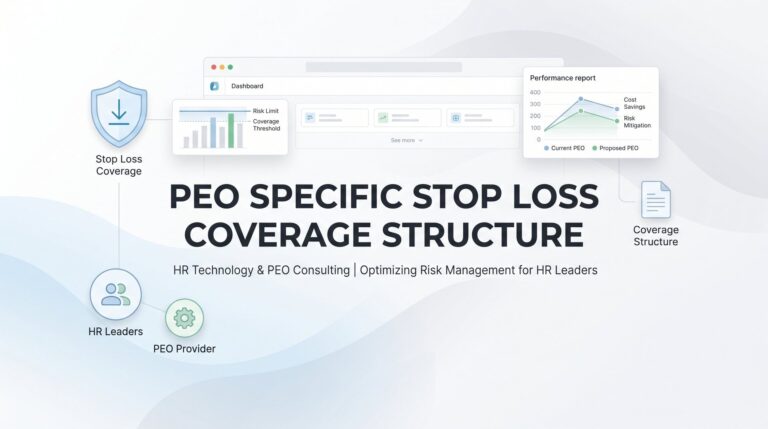
Understanding the PEO specific stop loss coverage structure is critical for businesses evaluating PEO proposals, yet most clients never see the actual policy terms or know how attachment points directly influence their annual renewal rates. This breakdown explains exactly how per-individual stop loss thresholds work within PEO health plan arrangements, what financial risks they genuinely protect against, and where significant coverage gaps leave employers exposed.
A step-by-step guide to accurately calculating PEO workers comp savings using your own data rather than relying on inflated sales projections. Learn the six-step process for building a realistic cost comparison—including hidden fees, payroll mapping, and rate structures—so you can determine whether a PEO genuinely reduces your workers’ compensation costs before signing a contract.
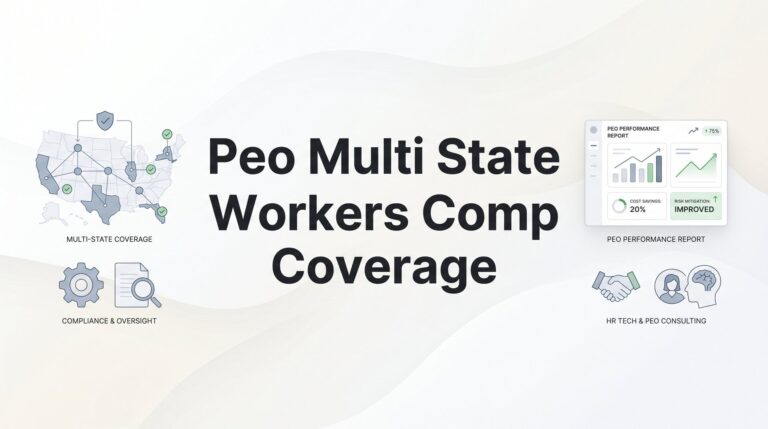
PEO multi-state workers’ comp coverage consolidates the complex state-by-state patchwork of policies, audits, and compliance requirements under one umbrella, eliminating the need to manage separate carrier relationships for each state where you have employees. This guide breaks down how the coverage actually works, where the real advantages lie, and the hidden gaps employers need to address before signing on with a PEO.
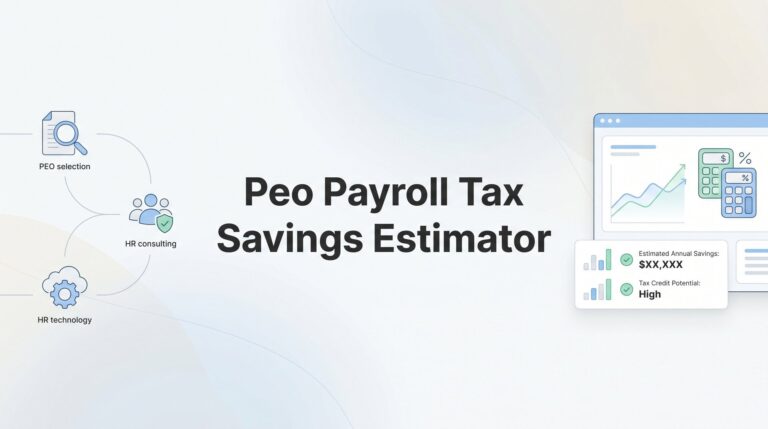
A structured six-step methodology helps business owners build their own PEO payroll tax savings estimator using existing payroll documents, isolating the specific cost categories — state unemployment taxes, workers’ comp, and fee structures — where PEOs actually impact the bottom line. Rather than relying on vague promises or optimistic sales projections, this approach lets you calculate a defensible savings estimate before engaging any provider.
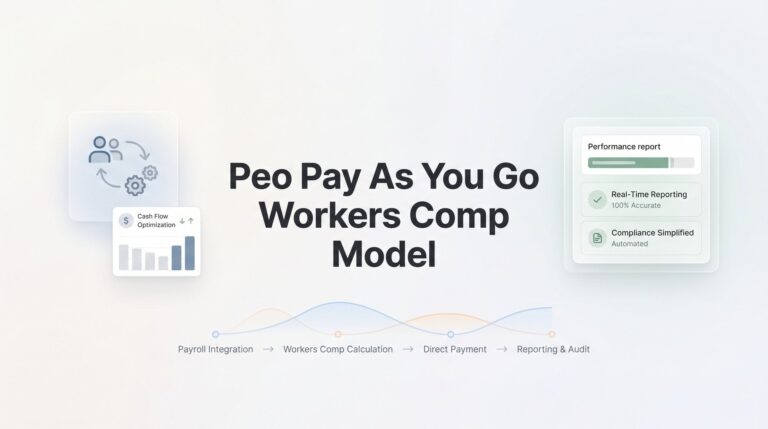
The PEO pay as you go workers comp model eliminates the guesswork of annual premium estimates by tying your payments directly to actual payroll each cycle. This article explains how the billing mechanism works, its real advantages over traditional coverage, and the experience mod rate implications most PEO sales conversations overlook.
PEO aggregate stop loss explained: this coverage caps your total claims liability during high-cost years, but most employers sign off on it without understanding how attachment points are set or what gaps exist. This breakdown covers how aggregate stop loss works within PEO health plans, how it differs from specific stop loss, and what to scrutinize during renewals to protect your bottom line.
A PEO audit risk cost avoidance calculator gives businesses a repeatable framework to quantify compliance and billing risks hidden inside their PEO arrangements, including overcharges, worker misclassifications, and inflated premiums. This step-by-step guide walks you through building a practical tool that measures your actual financial exposure and identifies how much money you could recover by catching PEO errors before they compound.
Small businesses in high-risk industries often pay steep standalone workers’ comp premiums, but a PEO’s master workers’ comp policy works differently by pooling employees across multiple companies to access better rates and underwriting terms. This guide explains the actual mechanics of how PEO master workers’ comp policy works, who benefits most from the structure, and how to evaluate whether it genuinely reduces your costs or simply repackages them.
Accurately projecting PEO master policy savings requires more than taking a vendor’s word for it — it demands a side-by-side comparison of your current rates, claims history, and workforce profile against the PEO’s actual master policy structure. This guide walks business owners through the specific calculations needed to determine whether pooled coverage will genuinely reduce costs or simply shift how those costs are structured.

Understanding PEO impact on experience modification factor is critical for business owners who want to know whether their PEO arrangement is genuinely reducing workers’ comp costs or simply restructuring how premiums are calculated. This breakdown explains how mod rates work inside PEO relationships, what happens to your claims history, and how to evaluate whether your current arrangement is actually working in your financial favor.
Most business owners paying for PEO services can’t identify their actual workers comp costs because PEOs intentionally bundle this expense within broader fees. This guide on PEO workers comp cost transparency explains how the pricing model works, what specific data points you should demand from your provider, and how to benchmark whether you’re overpaying for coverage—especially critical for businesses in high-risk industries like construction, manufacturing, and staffing.
Before signing a PEO contract, use a structured peo hr automation savings calculator approach to quantify exactly where time and money are being lost to manual HR tasks. This guide walks business owners through auditing current HR labor costs, identifying automation opportunities, and comparing projected savings against actual PEO pricing to build a defensible, data-backed business case.